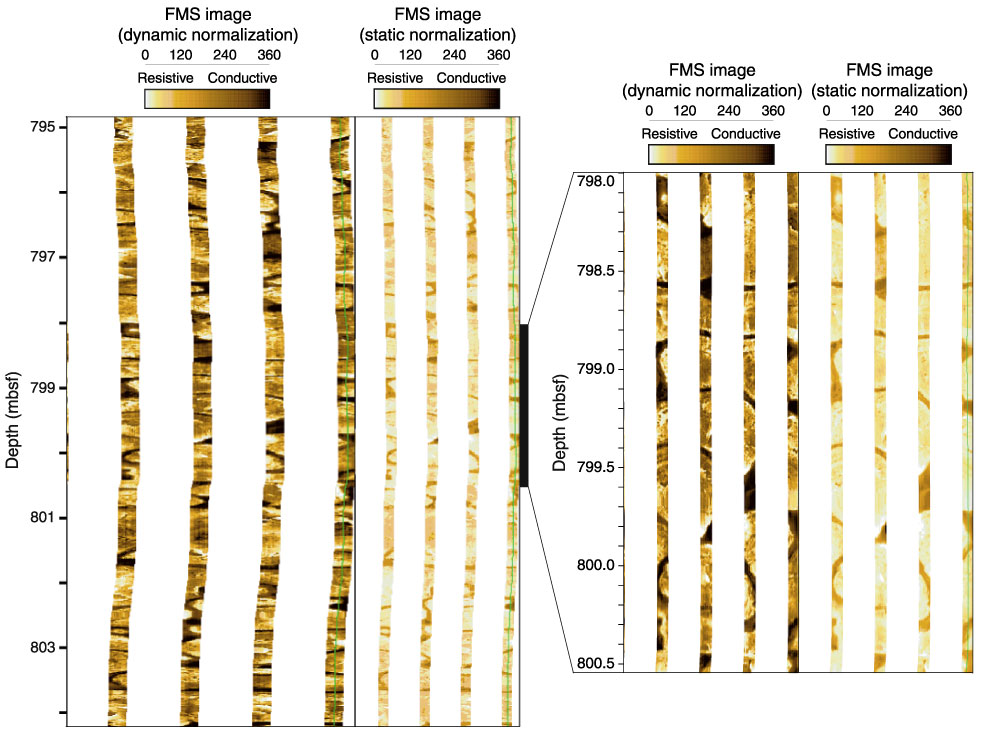
Figure F82. Detailed FMS image displaying typical pillow lobes in basement (part of Unit 23 from 799 to 808 mbsf). On the left is displayed 10 m of this unit section consisting of homogeneous pillow lobes. Both dynamic and static normalization are shown. These different normalizations differ by the computation window size for the color attribution to a selected microresistivity value. For the static normalization, a single computation is carried out in a window covering the entire section, and for the dynamic normalization separate computations are repeated at regularly spaced intervals using a sliding window of relatively short length. The pillow rims are outlined by dark colors corresponding to conductive material. On the right is a detailed display of the pillow. At 799.5 mbsf we note the occurrence of vesicles parallel to the pillow rims.