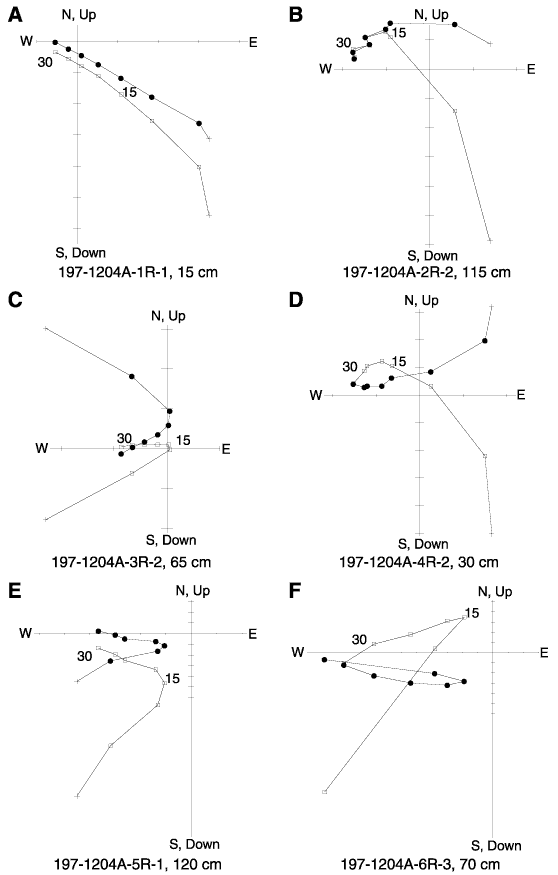
Figure F40. Example orthogonal vector plots for select levels of archive half-round sections of sediment recovered above basement in Hole 1204A showing departures of the magnetization from ideal behavior with alternating field demagnetization: Samples (A) 197-1204A-1R-1, 15 cm, (B) 2R-2, 115 cm, (C) 3R-2, 65 cm, (D) 4R-2, 30 cm, (E) 5R-1, 120 cm, and (F) 6R-3 70 cm. Numbers adjacent to symbols signify alternating-field demagnetization level. Open squares = vertical projection of magnetization, solid circles = horizontal projection of magnetization.


![]()