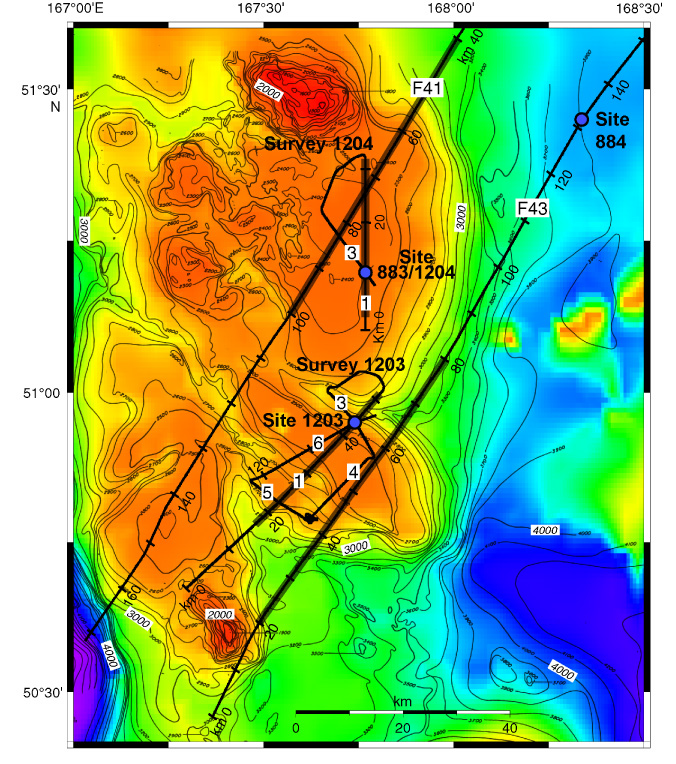
Figure F2. Map of Detroit Seamount with seismic lines from Leg 197 and F-2-87-AA. Tick marks indicate along-line distance in 10-km intervals from the beginning of the lines (F41 and F43) or from the beginning of the survey (Surveys 1203 and 1204). Thick gray bars show locations of seismic sections in Figures
F5, F6,
F7, and F8. Blue dots show locations of drill sites. Single-digit numbers in white boxes show line numbers for each survey. Contour map from Rea, Basov, Janecek, Palmer-Julson, et al. (1993). Color map from Smith and Sandwell (1997). Contour interval = 100 m, and contour labels are in meters.