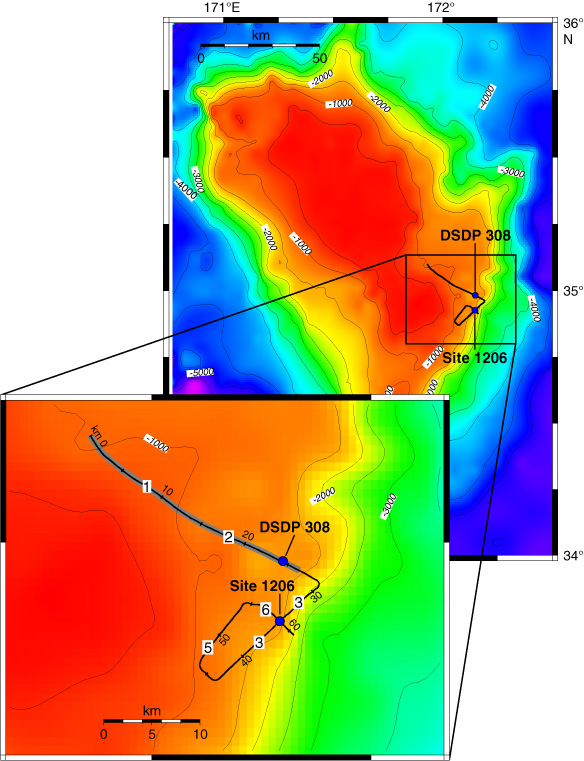
Figure F4. Map of Koko Seamount with seismic lines from Leg 197. Inset: Area immediately surrounding Survey 1206. Tick marks indicate along-line distance in 5-km intervals from the beginning of the survey. Thick gray bar shows the locations of seismic sections in Figure F10. Blue dots shows locations of drill sites. Single-digit numbers in white boxes show line numbers for this survey. Contour map interpolated from and color map from Smith and Sandwell (1997). Contour interval = 500 m.