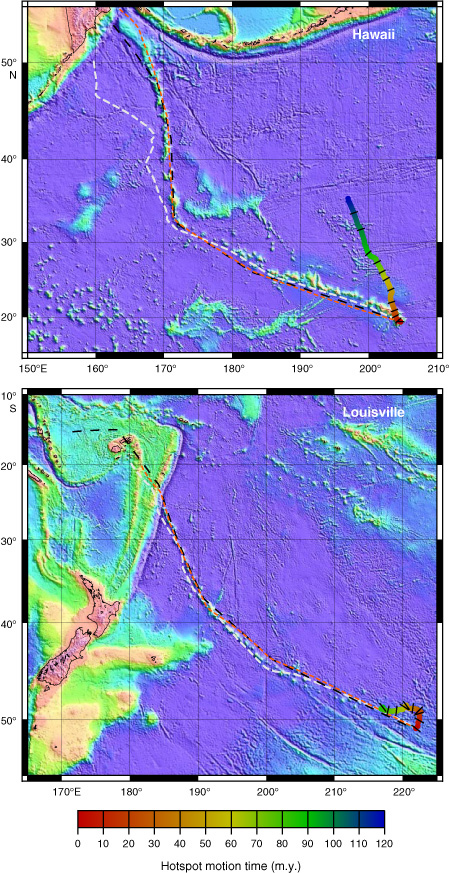
Figure F10. Computed hotspot motion and tracks for the Hawaiian and Louisville hotspots (from Koppers et al., 2004). Hotspot motion during the past 120 m.y. is shown as rainbow-colored paths, for times indicated on the colored scale bar. Tracks are shown as single-color dashed lines for Pacific fixed hotspots (black line), hotspot motion determined by Steinberger et al. (2004) (orange line), and best fit to global fixed hotspots (Steinberger et al., 2004) (gray line).