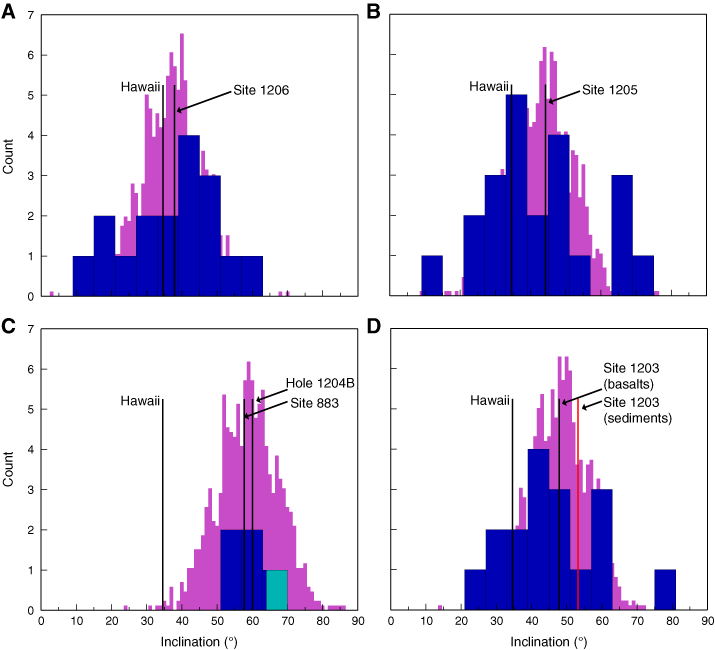
Figure F2. Paleomagnetic inclination groups for Sites (A) 1206, (B) 1205, (C) 1204, and (D) 1203 based on thermal demagnetization data (blue) shown compared with a synthetic Fisher distribution (magenta) that has the same mean as the experimental data and a dispersion predicted by global lava data (McFadden et al., 1991). Latitude of Hawaii, mean basalt inclination value (thermal demagnetization) for Hole 1204A (C, green), mean sediment inclination value (thermal demagnetization) for Site 1203 (D), and mean inclination value from ODP Site 883 basalts (Doubrovine and Tarduno, 2004b) are also shown (after Tarduno et al., 2003).


![]()