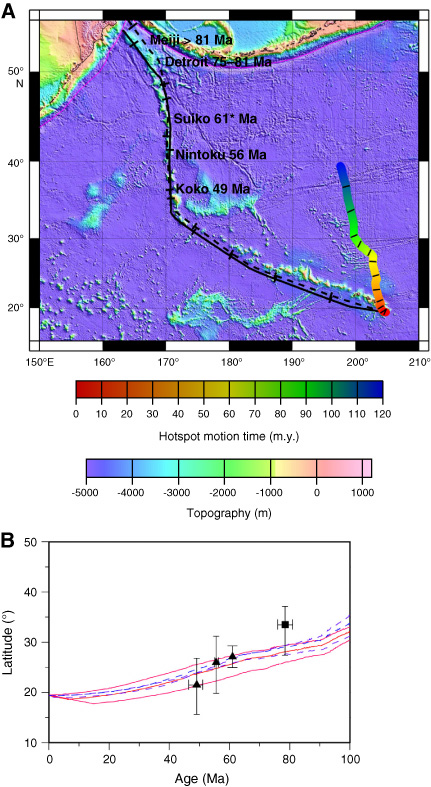
Figure F4. Comparison of geodynamic model results (Steinberger, 2000) and Leg 197 paleomagnetic results. A. Computed Hawaiian hotspot motion for moving source model (colored line) and tracks for fixed-source model (solid line; plume initiation at 160 Ma) and moving source model (dashed line; plume initiation at 170 Ma). Tick marks are 10-m.y. increments. B. Computed changes of hotspot latitude for fixed-source (solid red lines) for plume initiation ages of 150, 160, and 170 Ma (upper to lower). Moving source model results (dashed lines) are shown for plume initiation at 180, 170, and 160 Ma (upper to lower). Paleolatitude means for Koko, Nintoku, Suiko, and Detroit Seamounts (Model B, see text) are also shown. * = revised age for Suiko Seamount (Sharp and Clague, 2002) (after Tarduno et al., 2003).