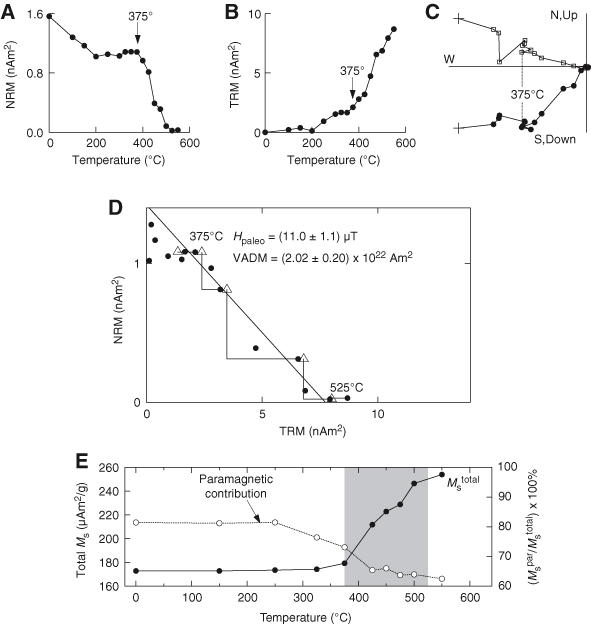
Figure F5. Example of paleointensity data using submarine basaltic glass from Site 1203 (from Smirnov and Tarduno, 2003). A. Thermal demagnetization of natural remanent magnetization (NRM). B. Acquisition of thermal remanent magnetization (TRM). C. Orthogonal vector plot of field-off steps (sample is unoriented). Open squares = vertical projection of NRM, solid circles = horizontal projection. D. NRM/TRM plot (circles). Squares = partial TRM experimental checks. E. Magnetic hysteresis parameters as a function of temperature on a monitor sample. The total saturation magnetization (Ms total) is shown before slope correction together with the paramagnetic contribution. The change in these curves denotes experimentally-induced alteration.


![]()