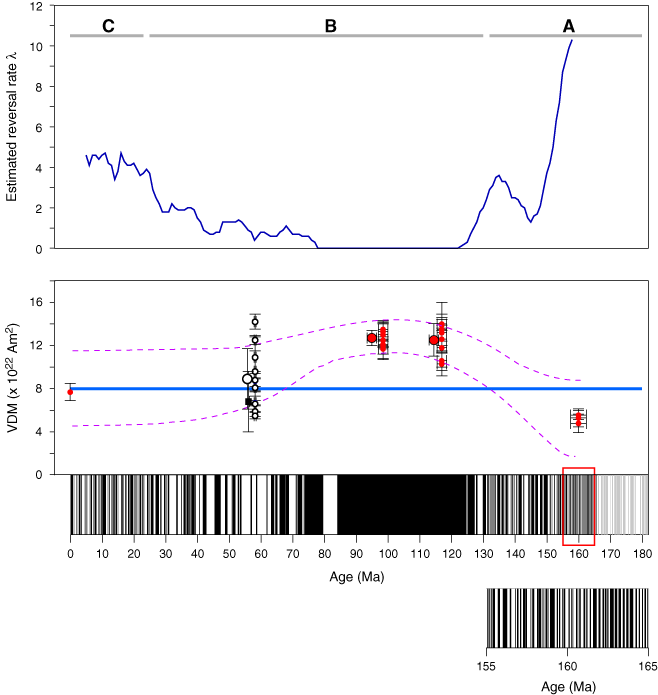
Figure F8. Thellier results from analyses of plagioclase crystals (after Tarduno and Cottrell, 2005) and paleointensity results from whole-rock lava samples from Carvallo et al. (2004a, 2004b) (square). Inset: expanded 165- to 155-Ma reversal chronology (Opdyke and Channell, 1996; Gradstein et al., 2004). Small circles = virtual dipole moments (VDM, cooling unit means of multiple single plagioclase crystal results) from Tarduno et al. (2001, 2002) and Tarduno and Cottrell (2005) (blue = Site 1205 results). Large symbols = averages of the VDMs, comprising paleomagnetic dipole moments, with 1 uncertainties. Dashed line = variation of paleomagnetic dipole moment standard variations consistent with the available data from single plagioclase crystals. Reversal rate curve is based on a 10-m.y. sliding window. Also shown is division of the reversal chronology into stationary and nonstationary intervals (A, B, C) from Gallet and Hulot (1997). Geomagnetic polarity timescale is from Cande and Kent (1995) and Gradstein et al. (2004).