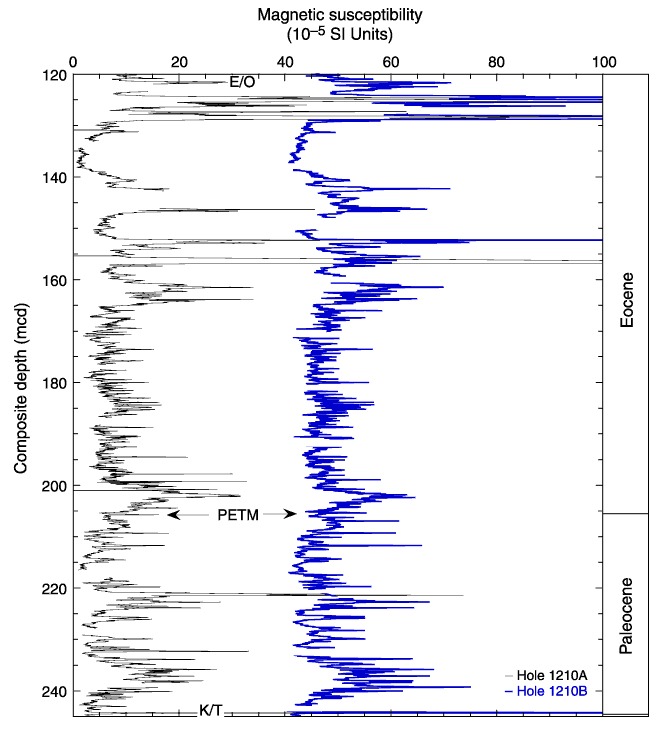
Figure F27. Comparison of magnetic susceptibility records for Holes 1210A (black) and 1210B (blue). The data show the location of critical events (PETM = Paleocene-Eocene Thermal Maximum, E/O = Eocene/Oligocene boundary, and K/T = Cretaceous/Tertiary boundary) as well as significant gaps in the records of individual holes. The accurate correction factor for the magnetic susceptibility data is 0.68 x 10⁻⁵.