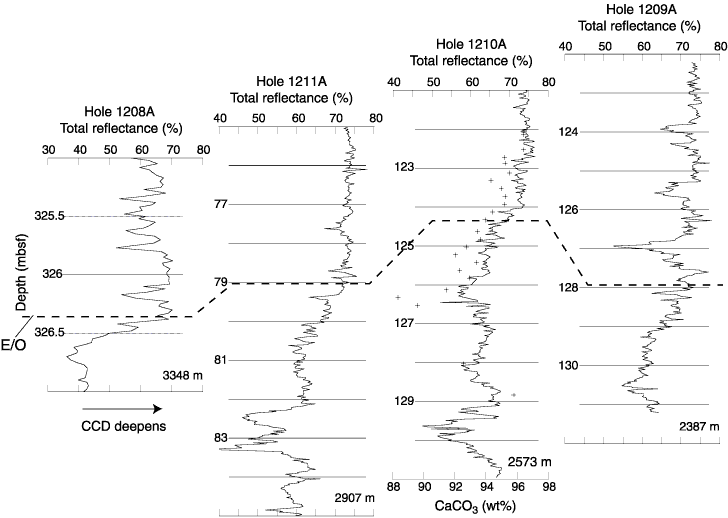
Figure F28. Total reflectance (L*) records for the Eocene/Oligocene (E/O) boundary interval at four sites (Holes 1209A, 1210A, 1211A, and 1208A) in a depth transect across Shatsky Rise. Reflectance (L*) is a rough indicator of CaCO3 content as demonstrated in the Hole 1210A plot where CaCO3 is plotted as well (crosses). These records suggest that CaCO3 increased across the Eocene-Oligocene transition, possibly because of a deepening of the lysocline and calcite compensation depth (CCD). Note that the deepest record (Site 1208) has the lowest L* values and highest amplitude of variation, probably because it is near the lysocline depth. Present water depths are indicated at the bottom of each plot.


![]()