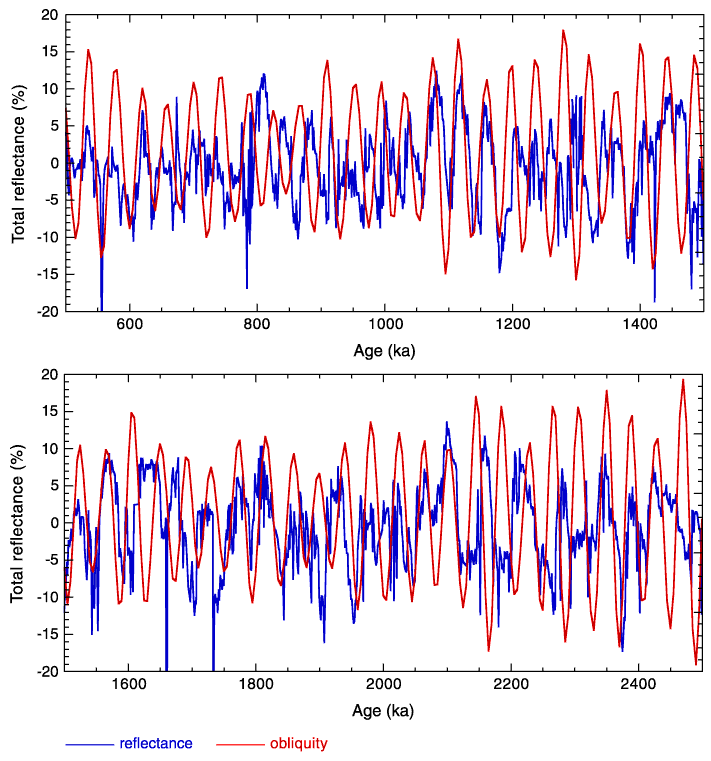
Figure F26. Plots of detrended color reflectance vs. age for the Pliocene-Pleistocene (0.6-2.5 Ma) with superimposed predicted angle of obliquity (data from Laskar, 1990) for the same interval. Color reflectance was detrended by taking a curve of mean reflectance and subtracting the point-to-point deviation of reflectance from it. Reflectance values were collected at 2.5-cm intervals, which is ~1 sample/1.5 k.y. on average for the interval selected. Note the approximate correspondence between the two curves, suggesting that obliquity drove the observed
cyclicity.


![]()