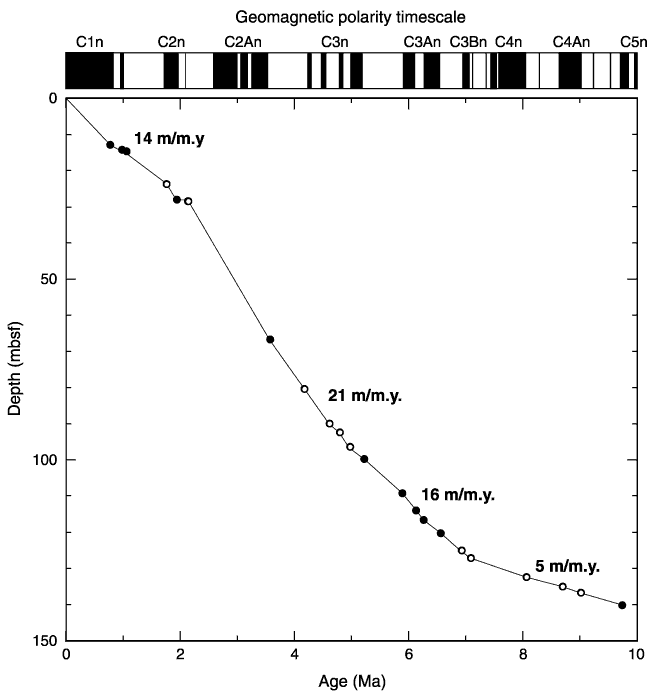
Figure F30. Age-depth curve for Site 1207 derived from magnetic stratigraphy, using the geomagnetic polarity time scale of Cande and Kent (1995) and showing the average sedimentation rates in meters per million years. Solid circles = more robust polarity chron interpretations, open circles = more tentative interpretations. Average sedimentation rates in meters per million years (m/m.y.) are also plotted. See Figure F20 in the "Site 1208" chapter for comparison.


![]()