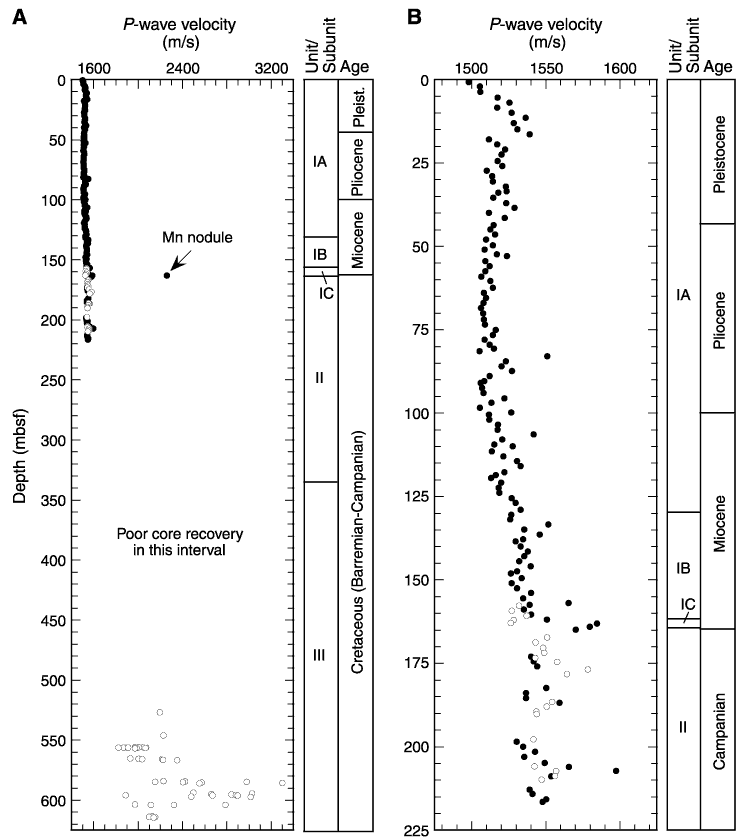
Figure F48. P-wave velocities for discrete samples from Holes 1207A (solid circles) and 1207B (open circles) vs. depth. A. Entire data set for Holes 1207A and 1207B. The very high P-wave velocities measured at chert horizons are not illustrated (see Table T19
for these data). B. Close-up of data for the Pleistocene to Campanian time interval. The high P-wave velocity measured for the ferromanganese nodule situated near the Campanian-Miocene unconformity is not shown (see Table T19 for this value).


![]()