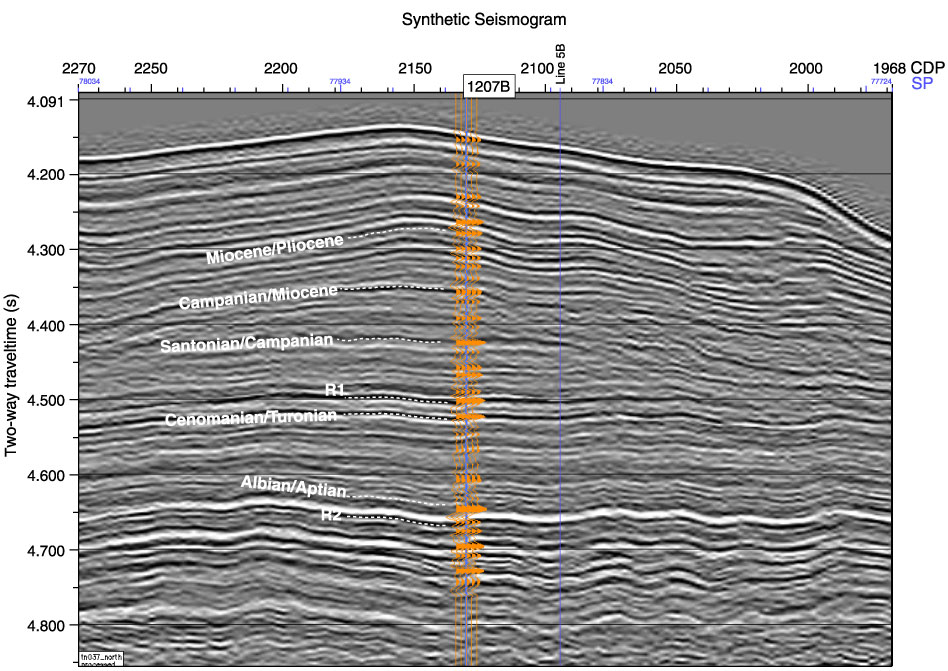
Figure F62. Synthetic seismogram plotted on seismic line Sager 5A. Geological boundaries observed in the core are plotted on the section. Black represents a positive reflection, white a negative reflection. 1207B = Hole 1207B, CDP =common depth point, SP =
shotpoint.