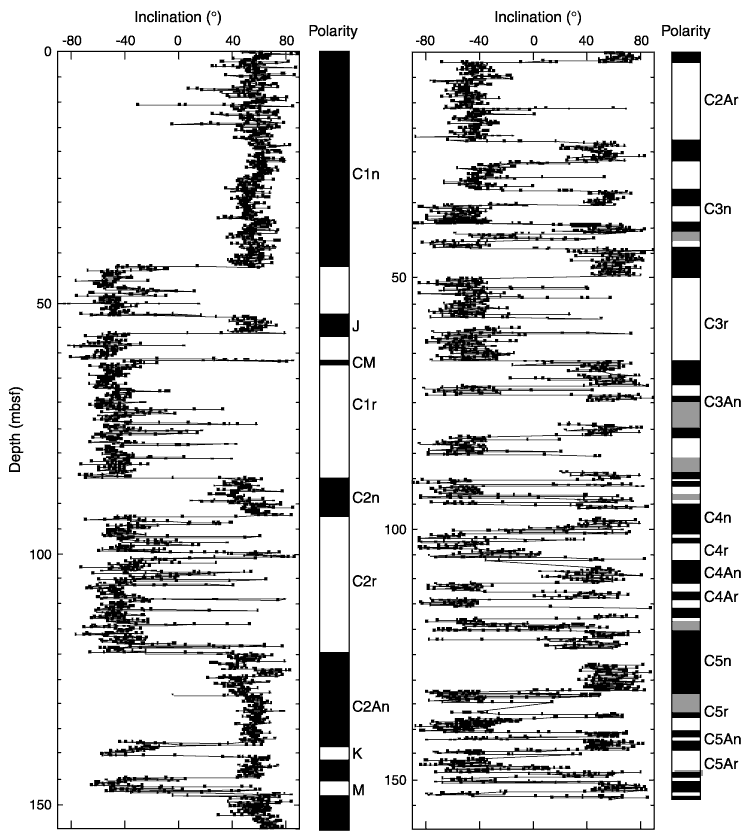
Figure F19. Inclination after AF demagnetization at peak fields of 20 mT as measured with the shipboard pass-through magnetometer at Hole 1208A. The column at the right of each plot shows interpreted zones of normal (black) and reversed (white) polarity. Gray intervals indicate zones in which no polarity interpretation is possible. Polarity zones at the top of the section and certain polarity zones farther downsection are tentatively correlated to polarity
chrons.


![]()