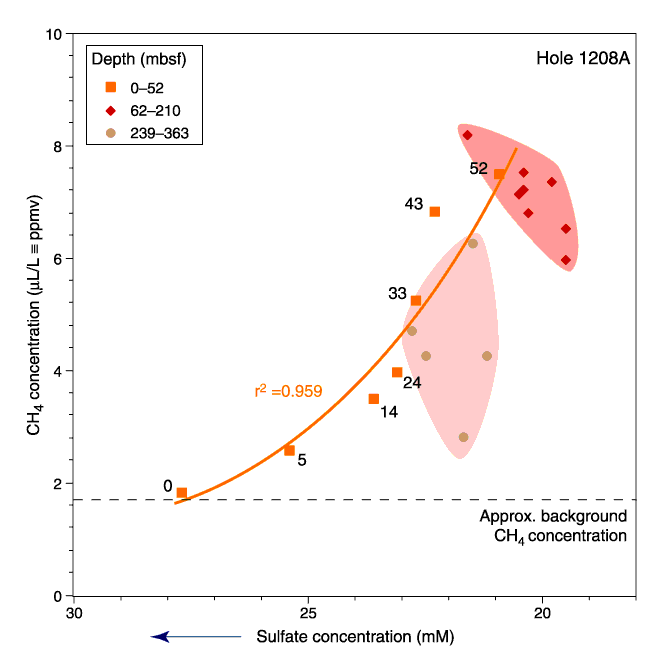
Figure F27.
Plot of decreasing sulfate concentration vs. CH
4
concentration for Site 1208. The inverse exponential relationship for the upper 52 m and groupings to depth are shown.