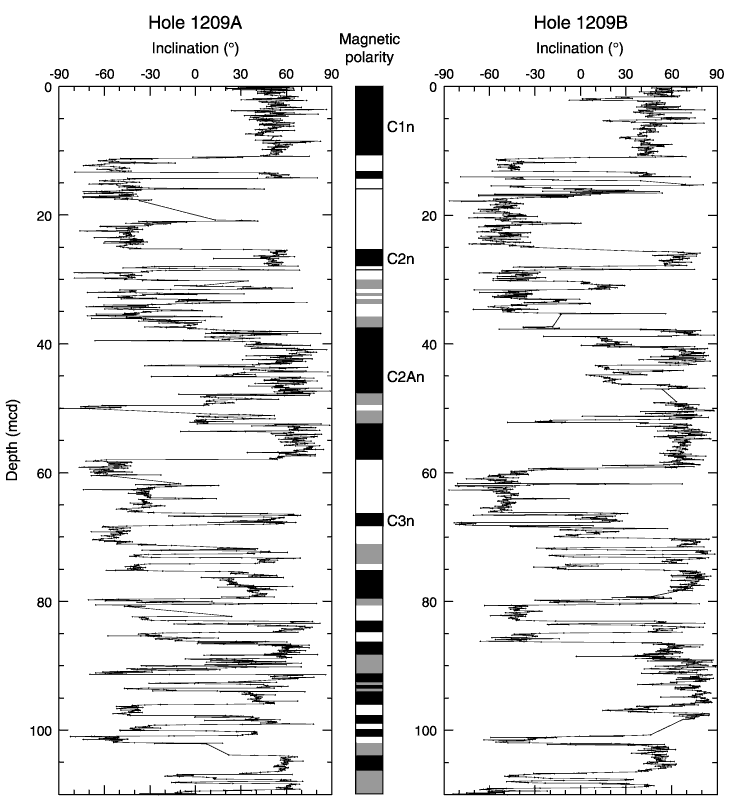
Figure F17. Inclination after AF demagnetization at peak fields of 20 mT as measured with the shipboard pass-through magnetometer for the upper 100 mcd at Holes 1209A and 1209B. The column at center shows interpreted zones of normal (black) and reversed (white) polarity. Gray intervals indicate zones in which polarity is uncertain.


![]()