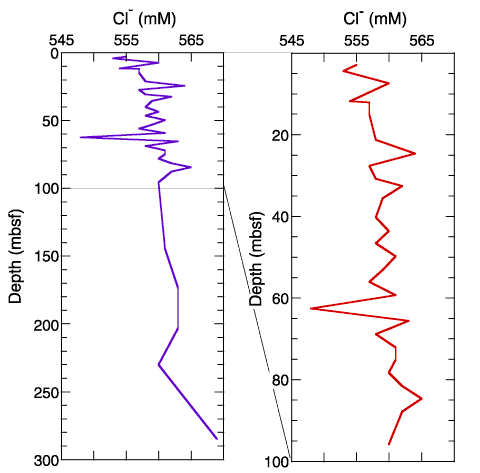
Figure F24.
Chloride ion concentrations at Site 1210. Variability in the downcore chloride profile is shown at Site 1210 (left) and at a higher resolution in the 0-100 mbsf interval (right).