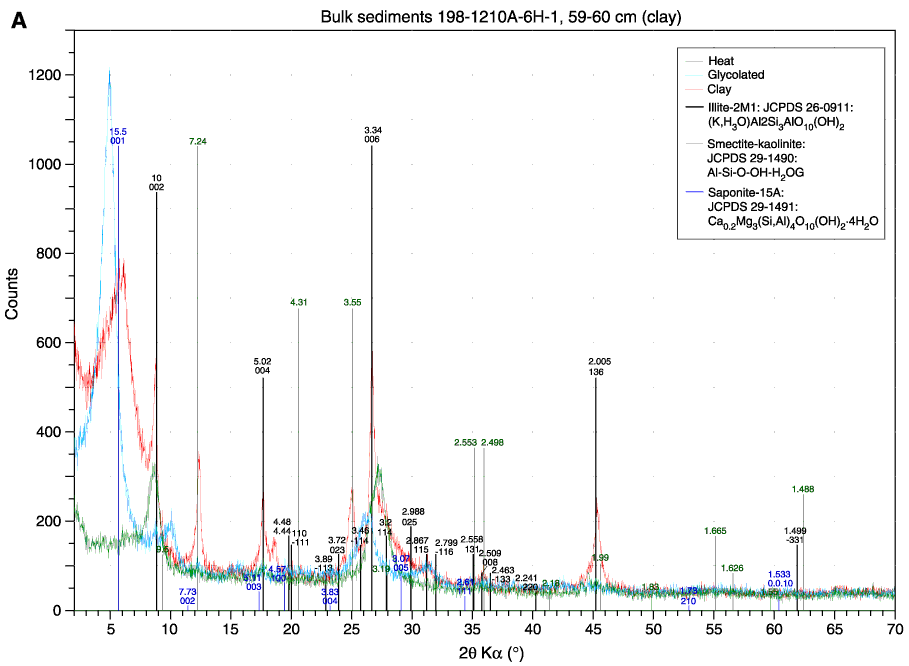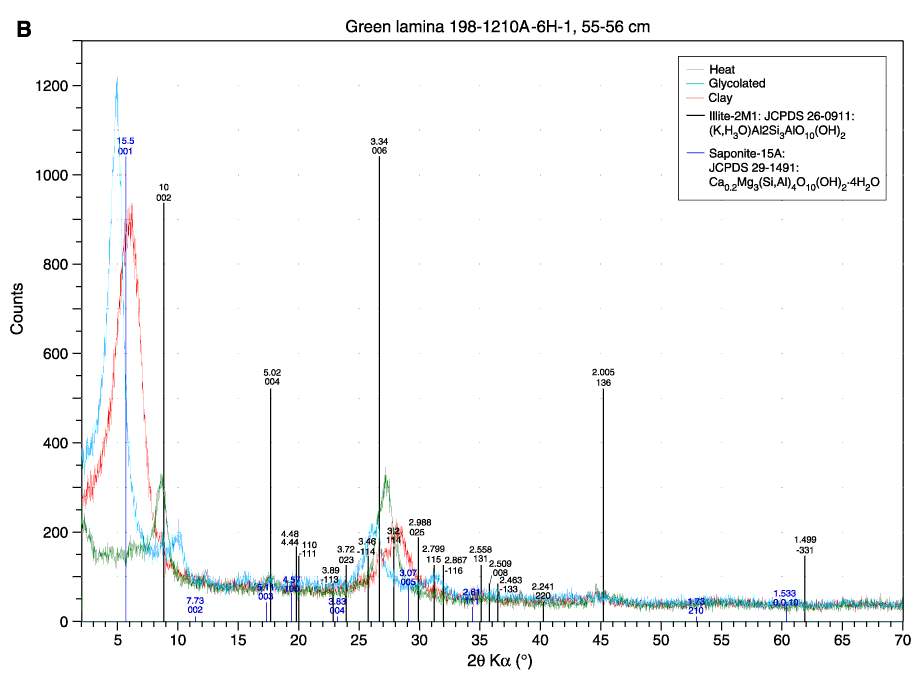
Figure F8. X-ray diffractograms for (A) bulk sediment, Section 198-1210B-6H-1. Curves are shown for three preparation treatments: acid-leached only (red), glycolated (blue), and heated (green). Peaks for clay minerals identified from diffractograms are superimposed on the data.
X-ray diffractograms for the (B) green lamina sampled from
Section 198-1210B-6H-1. Curves are shown for three preparation treatments:
acid-leached only (red), glycolated (blue), and heated (green). Peaks for clay
minerals identified from diffractograms are superimposed on the data.


![]()