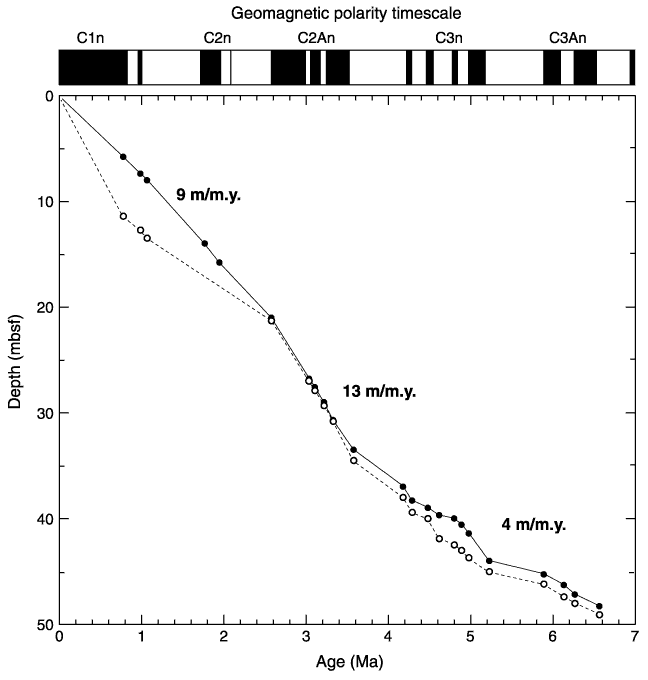
Figure F12. Age-depth curve derived from the Hole 1211A (solid symbols) and Hole 1211B (open symbols) magnetic stratigraphy shown in Figure F11, using the geomagnetic polarity timescale of Cande and Kent (1995). Average sedimentation rates are also plotted. Depths are in mbsf (differences between Holes 1211A and 1211B are reconciled when plotted vs. mcd depths).


![]()