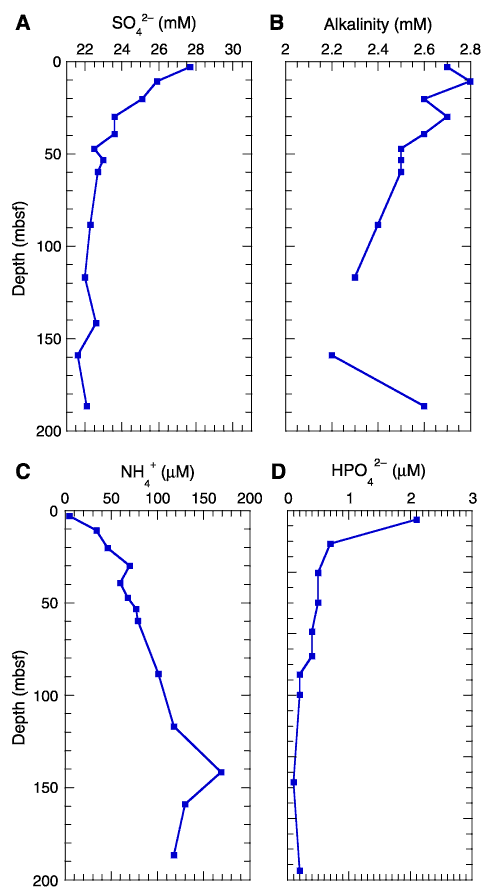
Figure F22. Site 1212 pore water profiles. A. Sulfate. B. Alkalinity. C. Ammonium. D. Phosphate. Compared with Sites 1209-1211, there is more sulfate reduction occurring at Site 1212. Low sample volume at 141.6 mbsf precluded a complete suite of analyses.


![]()