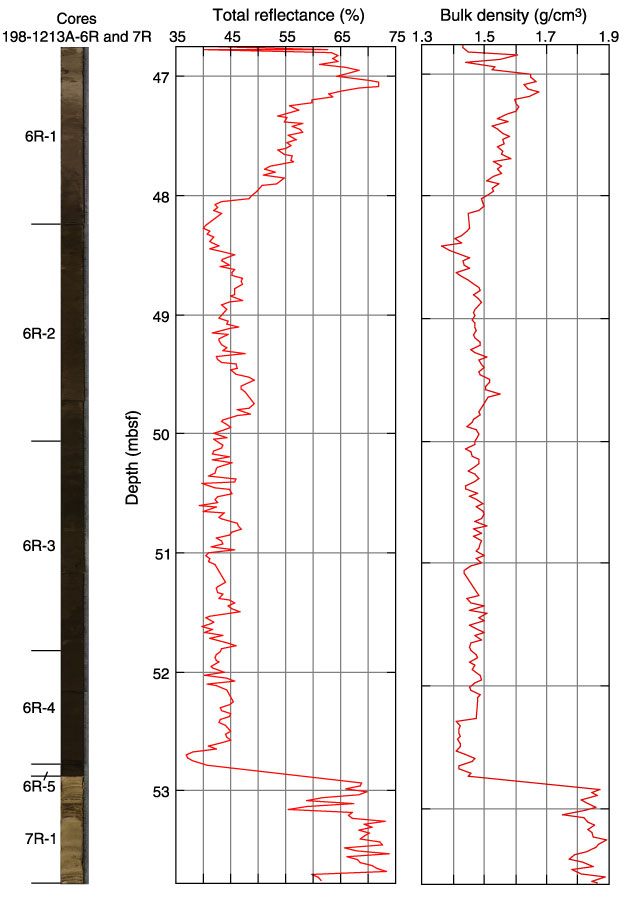
Figure F3. Composite digital photograph with total color reflectance (left panel) and bulk density (right panel) for Core 198-1213A-6R and Section 7R-1. The plot shows a sharp rise in total reflectance and bulk density at the boundary between the lower Pliocene and the Santonian at the Unit I/II contact.