![]() Figures F1-F8
Figures F1-F8
![]() Tables
T1-T9
Tables
T1-T9
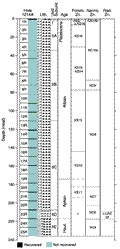
F1. Core recovery, lithologic units, and age with corresponding biostratigraphic zonations.
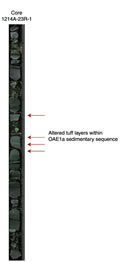
F2. Sedimentary sequence spanning OAE1a.
F3. Pyrite that has replaced radiolarians.
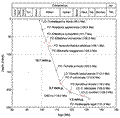
F4. Plot of chert and porcellanite color vs. age, ODP Sites 1207, 1213, and 1214, as well as DSDP Sites 305 and 306.
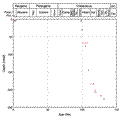
F5. Age-depth plot of calcareous nannofossil and planktonic foraminiferal datums.
F6. Age-depth plot of Early Cretaceous calcareous nannofossil and planktonic foraminiferal datums, with radiolarians from a single Aptian sample.
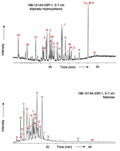
F7. GC-MS trace of aliphatic hydrocarbons and ketones.
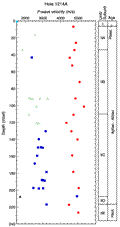
F8. P-wave velocities for discrete samples.
T1. Coring summary.
T2. Downhole variation in chert colors, Hole 1214A.
T3. Cenozoic and Cretaceous benthic foraminifers, Hole 1214A.
T4. Calcareous nannofossil datums, ages, and depths.
T5. Planktonic foraminifer datums, ages, and depths.
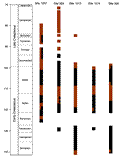
T6. Carbonate and elemental composition.
T7. Aliphatic hydrocarbons and ketone identities.
T8. Discrete measurements of P-wave velocity.
T9. P-wave velocities for lithologies.