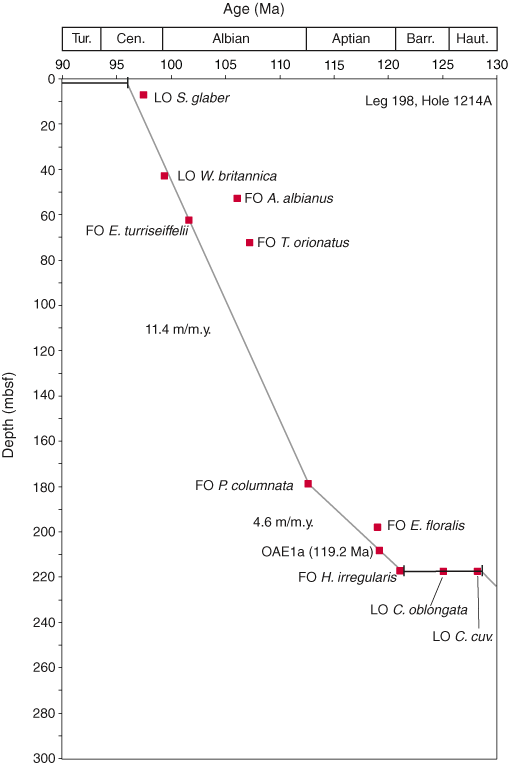
Figure F4. Age-depth plot of calcareous nannofossil datums from Site 1214. Red squares = nannofossil datums: actual depth in core (mbsf) vs. age from the Bralower, Premoli Silva, Malone, et al. (2002) timescale. OAE1a is also included in the plots. Horizontal black lines = hiatuses. FO = first occurrence, LO = last occurrence.