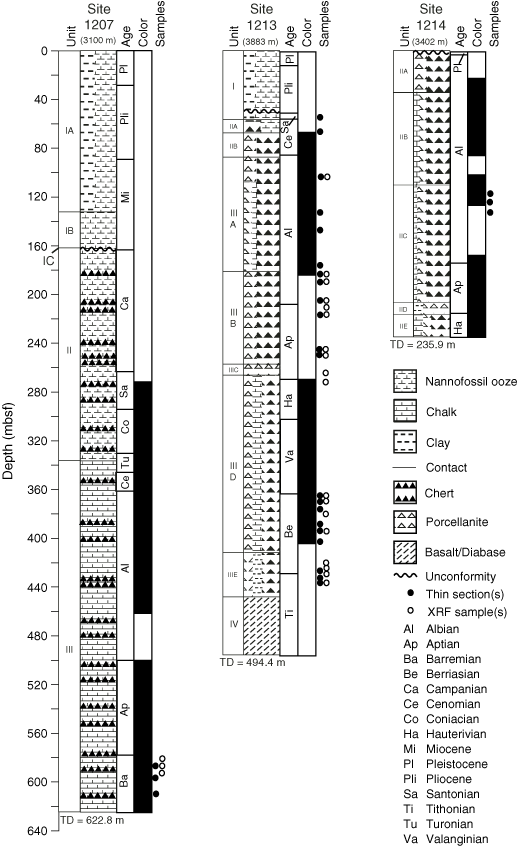
Figure F6. Lithostratigraphy at Sites 1207, 1213, and 1214 showing sample intervals and types of analyses (thin section, XRF) performed. Color column is provided to indicate intervals of predominantly gray and dark gray cherts (black) vs. intervals where chert is predominantly reddish brown (white). Modified from Bralower, Premoli Silva, Malone. et al. (2002). TD = total depth.


![]()