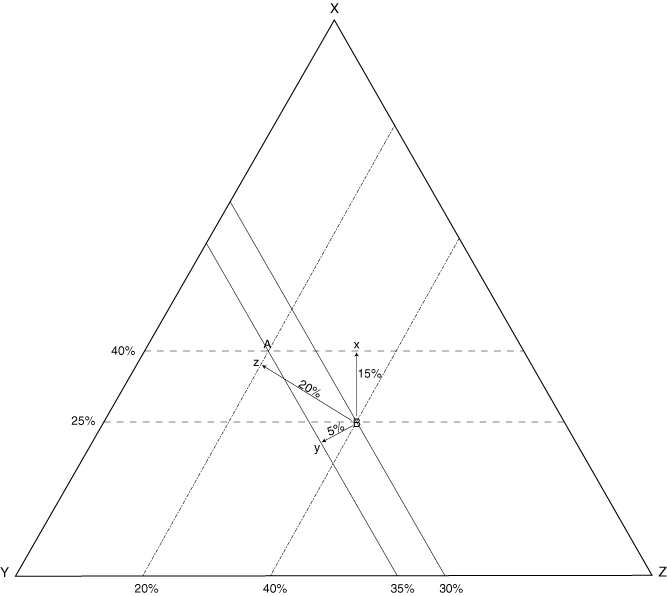
Figure F8. Schematic showing the quantitative method of likeliness of correlation. The percentage difference indicates the compositional "distance" between samples A and B in ternary space. The lesser of the three distances was chosen to represent the likeliness of correlation for a given plot in Table T4.


![]()