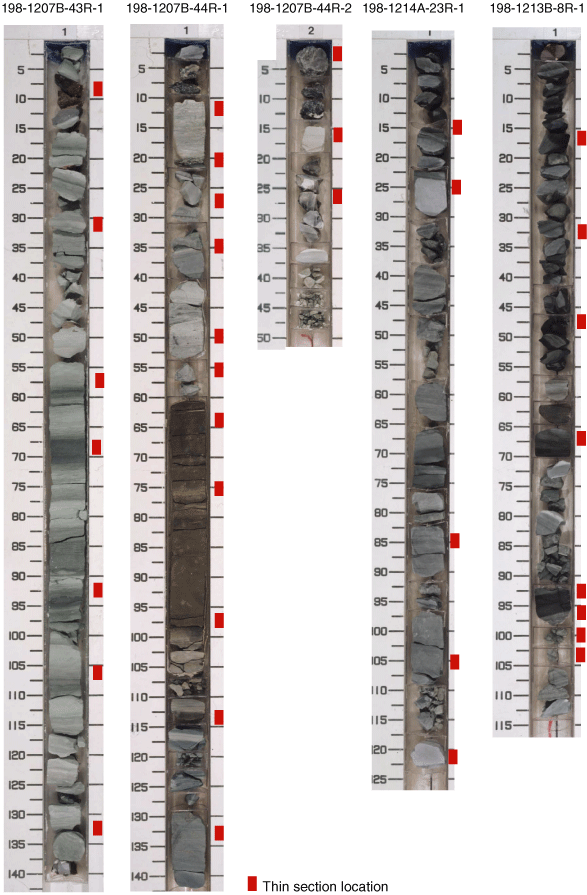
Figure F3. Series of core photographs from Bralower, Premoli Silva, Malone, et al. (2002) showing OAE1a core sections and sample intervals (red). Vertical scale is in cm. Note that core photographs are of archive halves, whereas samples were taken from the working halves of cores. The position of the red rectangles, representing sample intervals, were slightly shifted, if necessary, to correspond to the exact archive half of the sample analyzed.


![]()