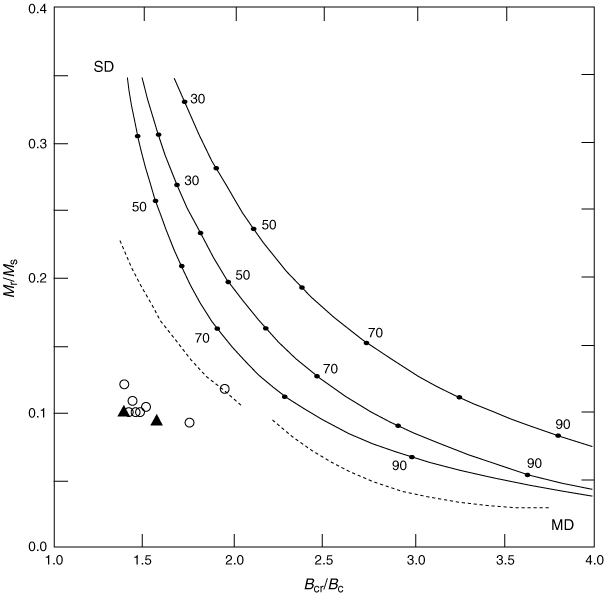
Figure F4. Plot of Mr/Ms (saturation remanence/saturation magnetization) vs. Bcr/Bc (remanent coercivity/coercivity field) for Hole 1213B basalt samples. Open symbols denote samples that gave inconsistent demagnetization results, whereas solid triangles show samples that gave consistent results. Curves represent theoretical mixing model for single-domain (SD) and multidomain (MD) magnetite grains (Dunlop, 2002a, 2002b). Numbers at points along line give percentage of MD grains in mixture. Dashed lines show trends from some published dolerite, gabbro, and peridotite samples (Dunlop and Prévot, 1982).