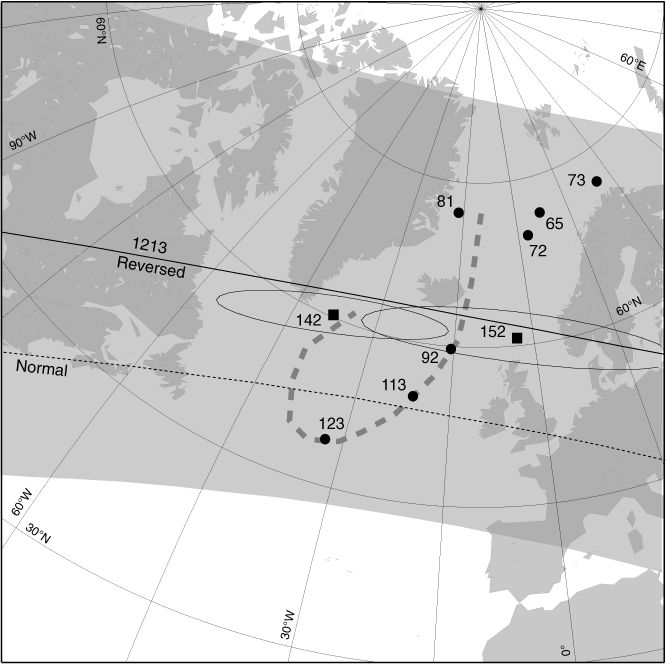
Figure F6. Colatitude arcs for Hole 1213B basalt samples compared with Cretaceous and Jurassic paleomagnetic poles. Solid squares show Jurassic (152 Ma) and Early Cretaceous (142 Ma) poles from magnetic lineation skewness (Larson and Sager, 1992). Solid circles are Late and mid-Cretaceous poles from other sources (72 Ma, Sager and Pringle, 1988; 65 Ma, Acton and Gordon, 1991; 73 Ma, Petronotis and Gordon, 1999; 81 Ma, Sager, 2003; 92, 113, and 123 Ma, Sager, in press a). Solid arc shows locus of poles predicted by assuming reversed polarity, whereas dashed arc shows locus of poles assuming normal polarity. Ellipses show 95% confidence regions for the Jurassic and Early Cretaceous poles; other pole error ellipses are omitted for clarity. Gray band shows estimated region of 95% confidence for the normal colatitude arc. Heavy dashed line shows trend of Pacific apparent polar wander path.


![]()