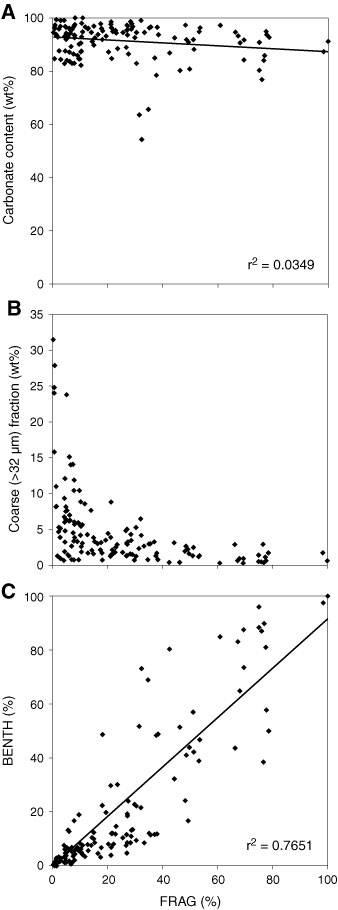
Figure F8.
Bivariant plots of potential dissolution indexes.
A.
FRAG vs. Carbonate content.
B.
FRAG vs. Coarse fraction.
C.
FRAG vs. BENTH.