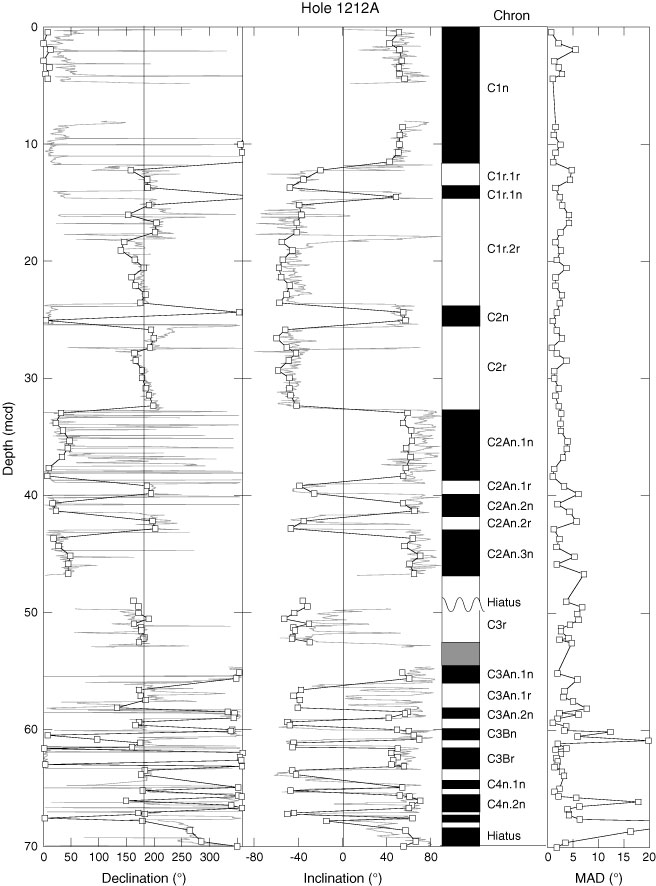
Figure F8. Site 1212 component inclination and declination from discrete samples (open squares). Inclination and rotated declination from the shipboard pass-through magnetometer after AF demagnetization at peak fields of 20 mT (gray line). Chrons are labeled according to Cande and Kent (1992). Black = normal polarity, white = reversed polarity. Also shown are the maximum angular deviation (MAD) values calculated for discrete sample data (after Kirschvink, 1980).