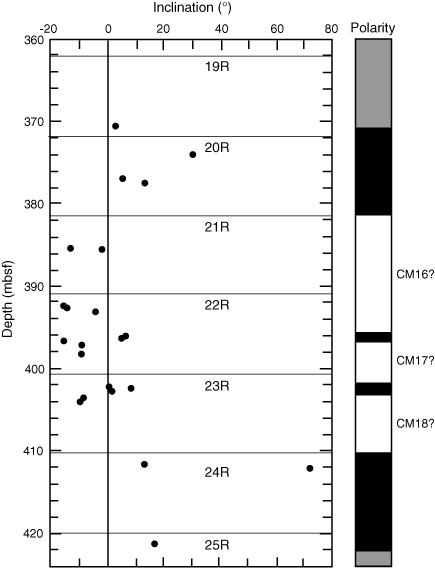
Figure F10. Magnetic polarity interpretation of Hole 1213B Lower Cretaceous sediment samples between 360 and 424 mbsf. Solid circles = inclination values for samples; subbottom depth has been recalculated to expand recovered core to fill the cored intervals. Polarity interpretation is shown at right: black = normal polarity, white = reversed polarity, and gray = uncertain polarity (from Sager et al., this volume).


![]()