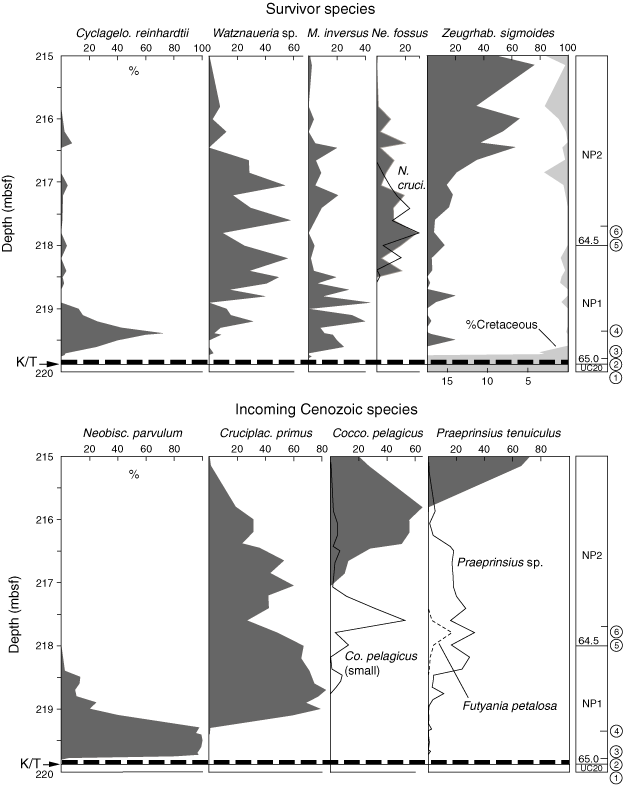
Figure F18. Abundances of principal Cretaceous/Tertiary boundary (K/T) survivor and incoming Cenozoic nannofossils. Survivor species counts are percentages of survivor assemblage. Incoming Cenozoic species counts are percentages of total assemblage. Line plots = additional taxa; dashed line = interval of mixed-reworked nannofossil taxa, and heavy dashed line = K/T boundary level (after Bown, 2005).