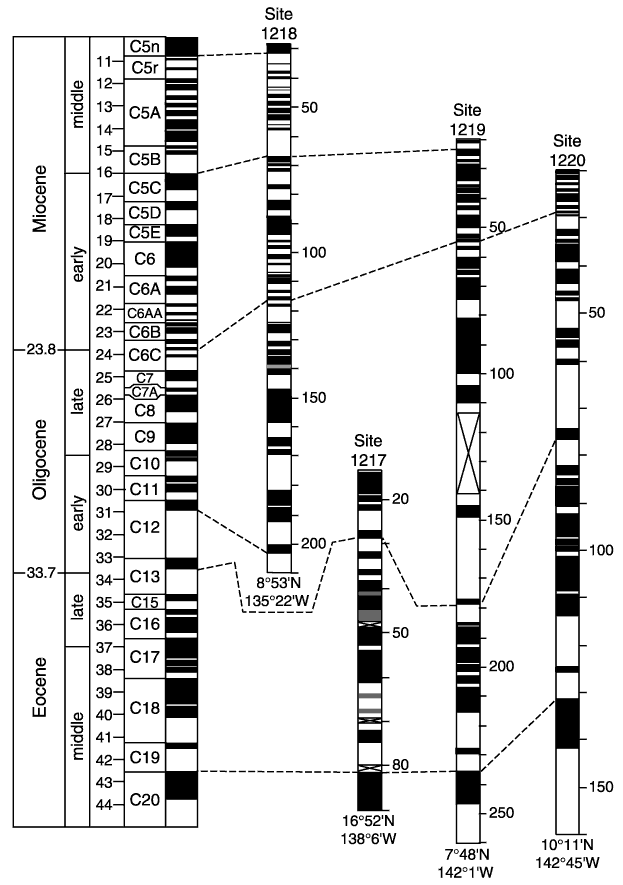
Figure F22. Synthesis of magnetic stratigraphy from four Leg 199 drill sites. Depth scale in mcd is shown on the right of each column, and geographic coordinates are shown at the bottom of each column. Black = normal magnetic polarity, white = reversed magnetic polarity, gray = no polarity assignment possible. Crosses = intervals with no data, dashed lines = correlation between selected chrons to the GPTS (Cande and Kent, 1995).


![]()