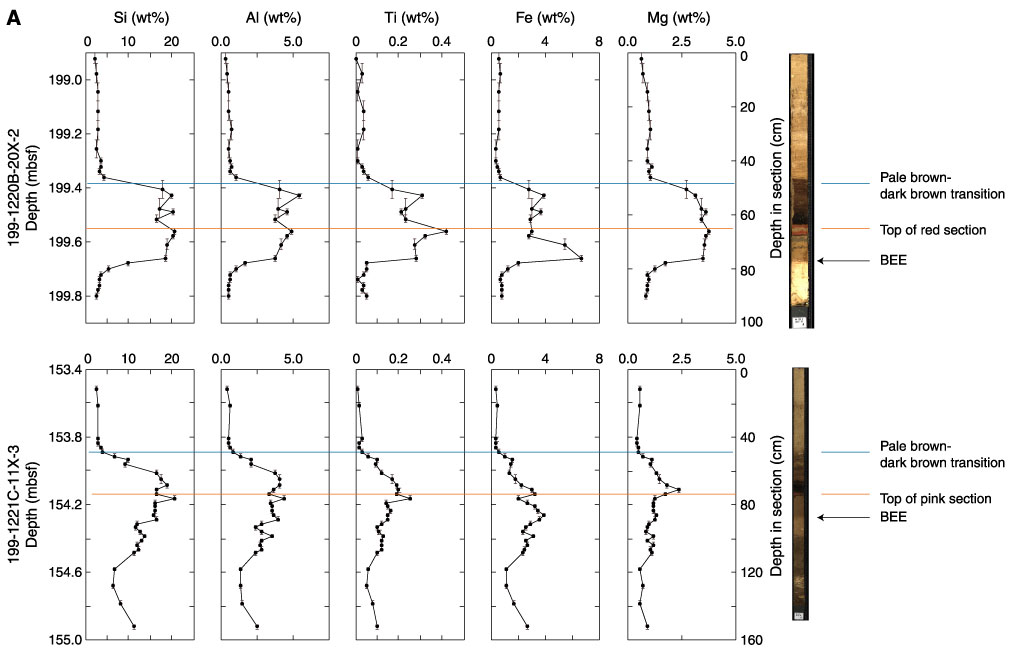
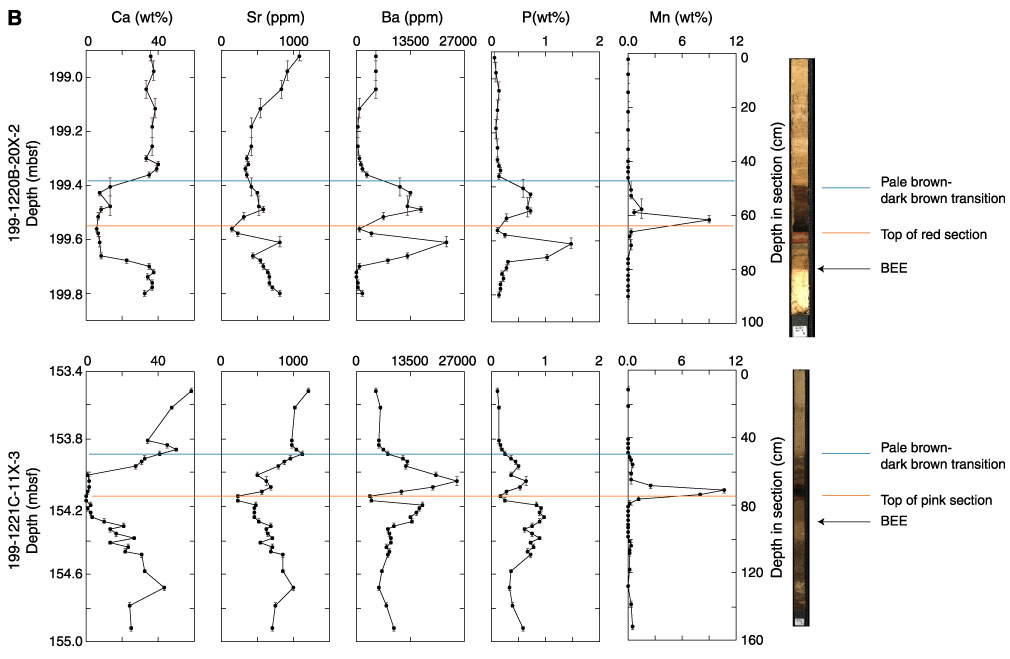
Figure F33. A. Composite digital photograph of shipboard ICP-AES analyses of Si, Al, Ti, Fe, and Mg on 2-cm Corg scrapes across the Paleocene-Eocene (P/E) boundary from Sites 1220 and 1221. Elevated concentrations of all these elements in the boundary interval reflect low CaCO3. Different levels of elements through the interval reflect the distinct color bands. B. Composite digital photograph of shipboard ICP-AES analyses of Ca, Sr, Ba, P, and Mn on 2-cm Corg scrapes across the P/E boundary from Sites 1220 and 1221. The difference in behavior between Ca and Sr reflects recrystallization. A strong Mn peak flanked by P and Ba peaks is characteristic of the boundary interval. BEE = benthic extinction event.