
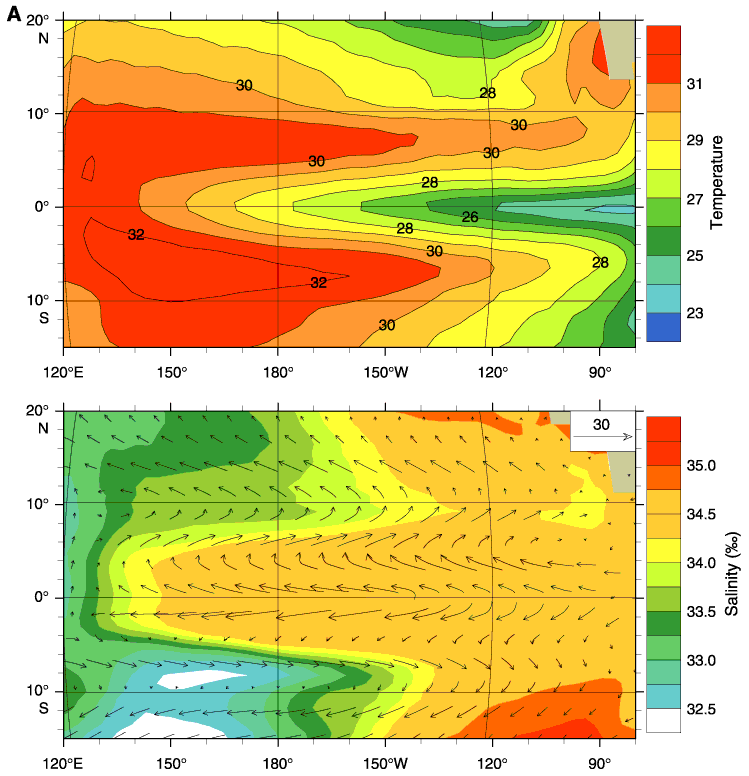
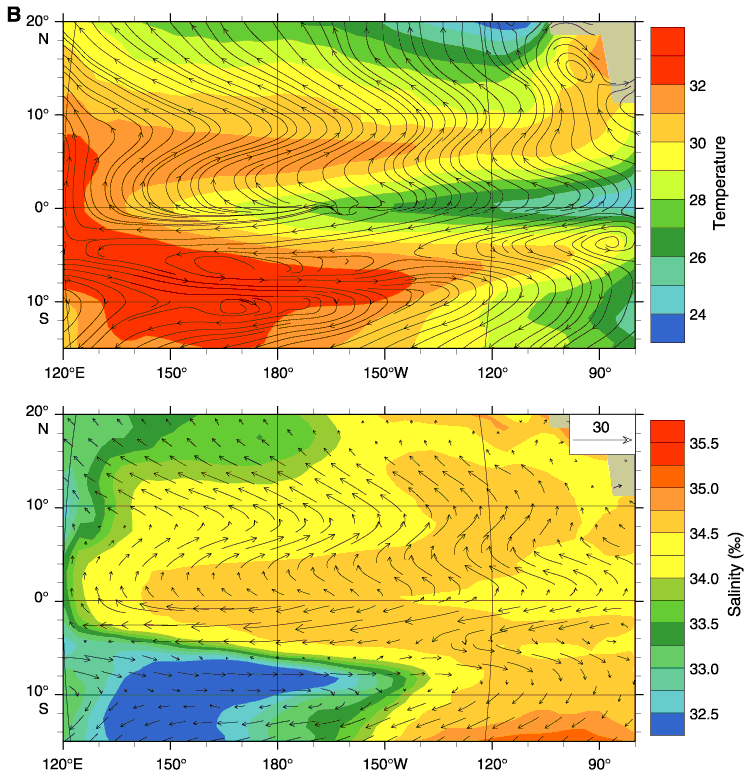
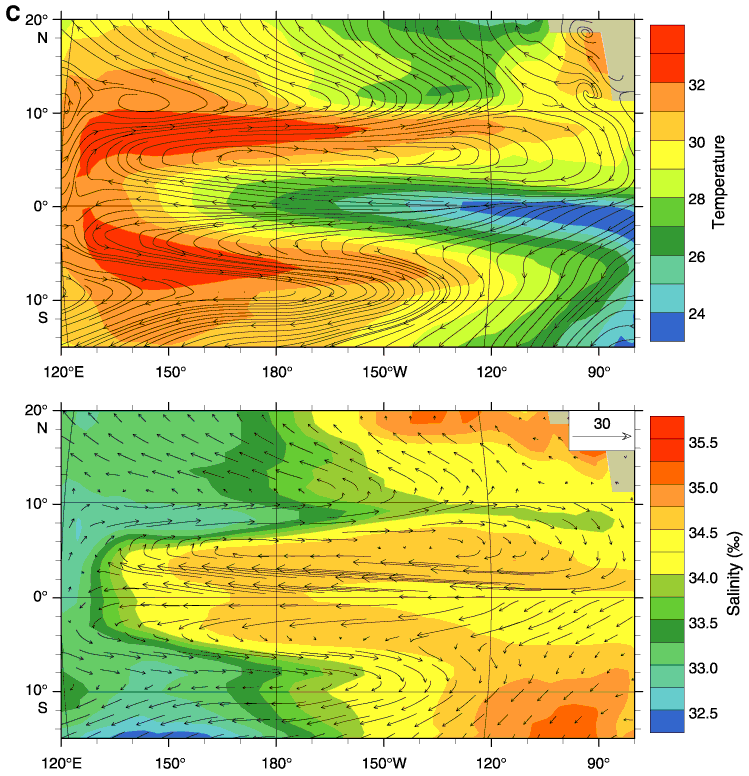
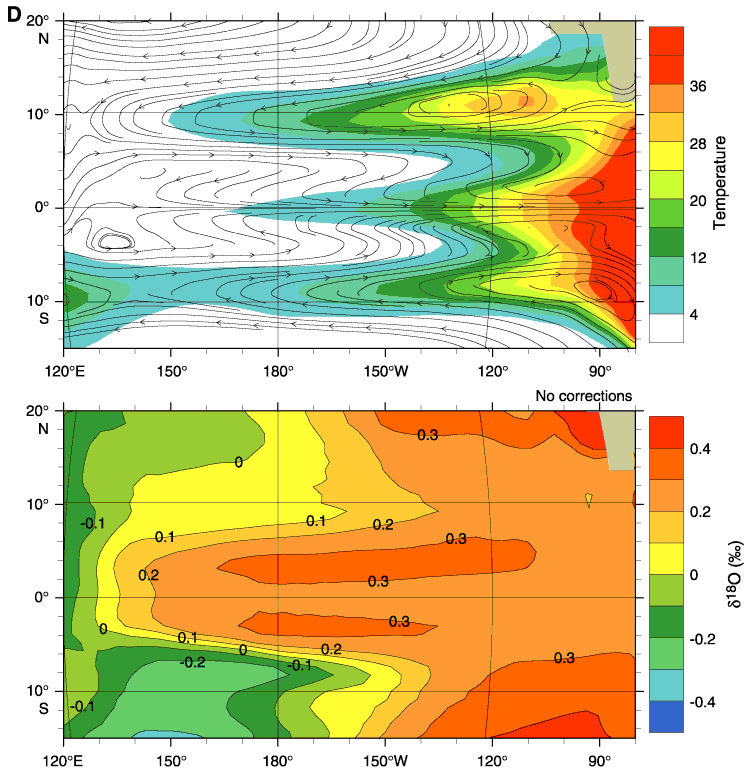
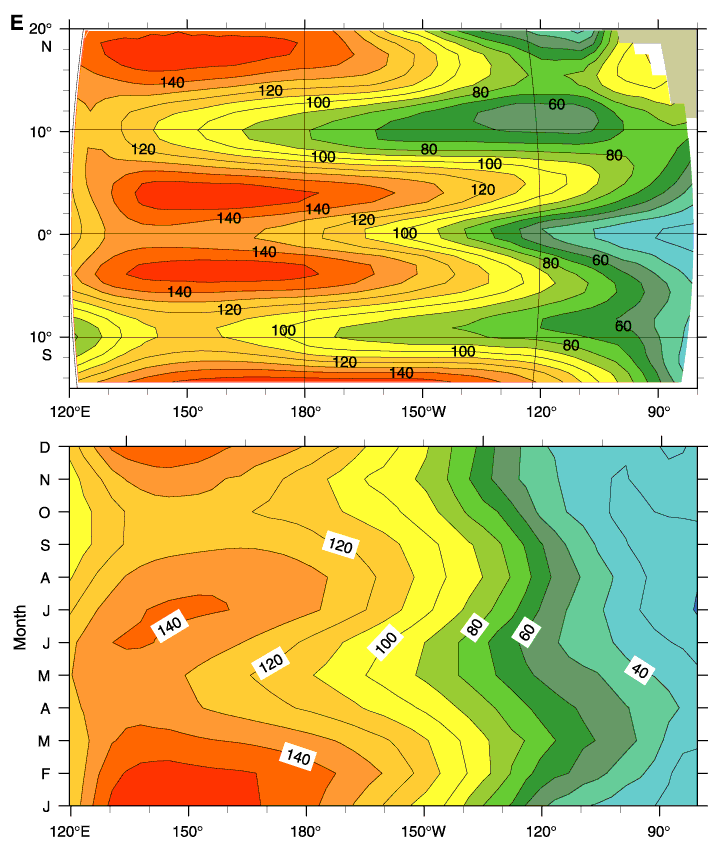
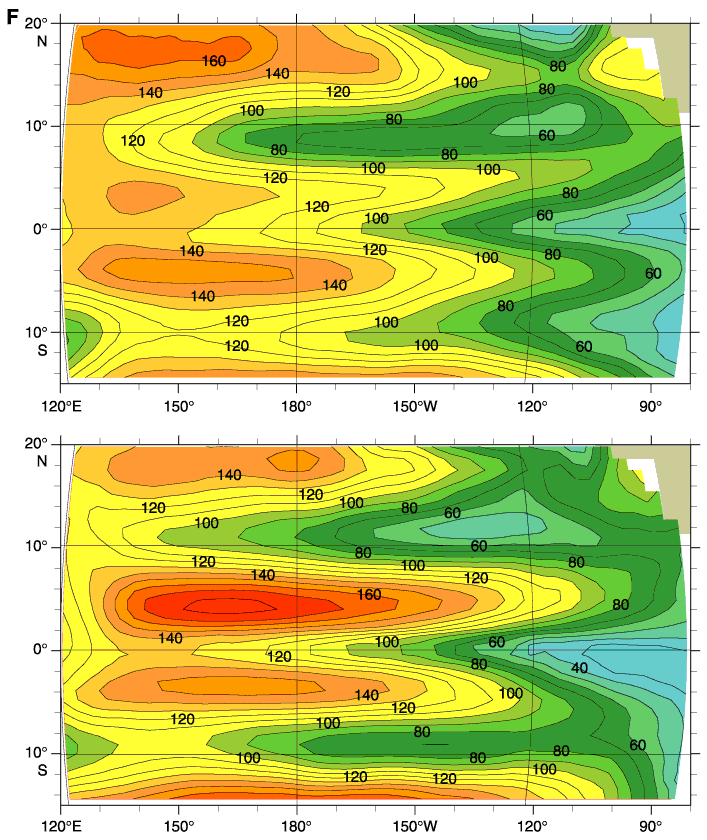
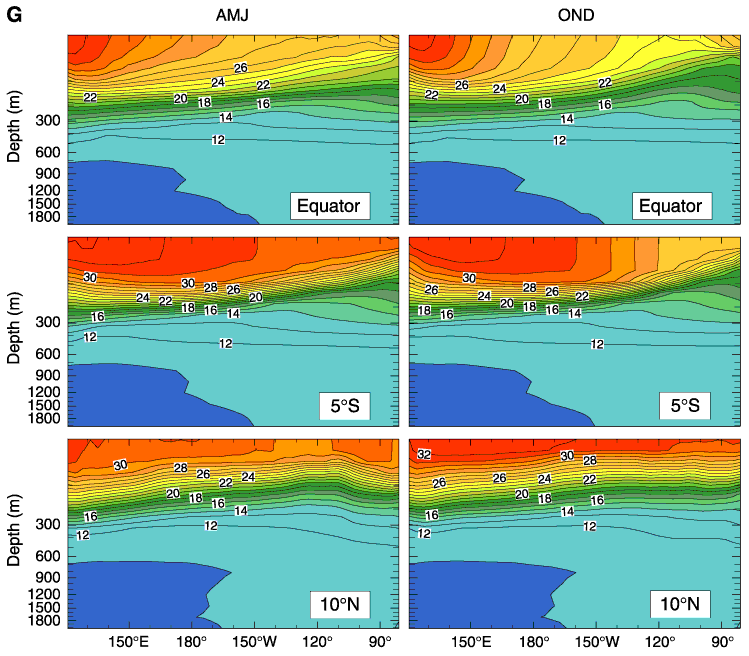
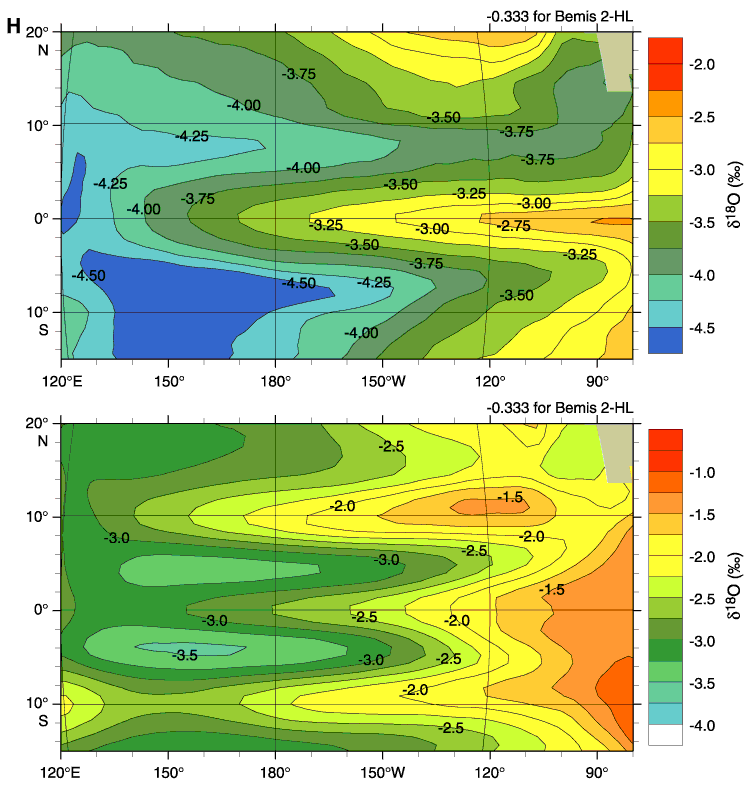
Figure F3. Quantities averaged through the upper 30 m of the model, which correspond roughly to the Ekman layer and the mixed layer depth (with exceptions as noted below). A. Annual average temperature (top) and salinity and current vectors (centimeters per second) (bottom) in this layer. B. AMJ average temperature and streamlines (top) and AMJ salinity and current vectors (centimeters per second) (bottom) in the Ekman Layer (upper 30 m). C. OMD average temperature and streamlines (top) and OMD salinity and current vectors (centimeters per second) (bottom) in the Ekman Layer (upper 30 m). D. Annually averaged upwelling into the upper 30 m (Ekman Layer) (top) and streamlines (bottom) are shown. Green to blue = regions of weak upwelling, white = areas of mean downwelling. Estimated seawater  18O
18O VMSO (Fairbanks et al., 1997). E. The mean annual depth (24°C isotherm) (top) and seasonal cycle of the thermocline (bottom). F. Thermocline depth of the 24°C isotherm at 115°W. G. Transects of temperature along the equator at 5°S and 10°N for two seasons. AMJ = April, May, June; OND = October, November, December. H. Estimated
  c averaged annually, averaged in the upper 30 m (top), and averaged between 60 to 160 m (bottom).

 18O
18O VMSO (Fairbanks et al., 1997). E. The mean annual depth (24°C isotherm) (top) and seasonal cycle of the thermocline (bottom). F. Thermocline depth of the 24°C isotherm at 115°W. G. Transects of temperature along the equator at 5°S and 10°N for two seasons. AMJ = April, May, June; OND = October, November, December. H. Estimated
  c averaged annually, averaged in the upper 30 m (top), and averaged between 60 to 160 m (bottom).


![]()