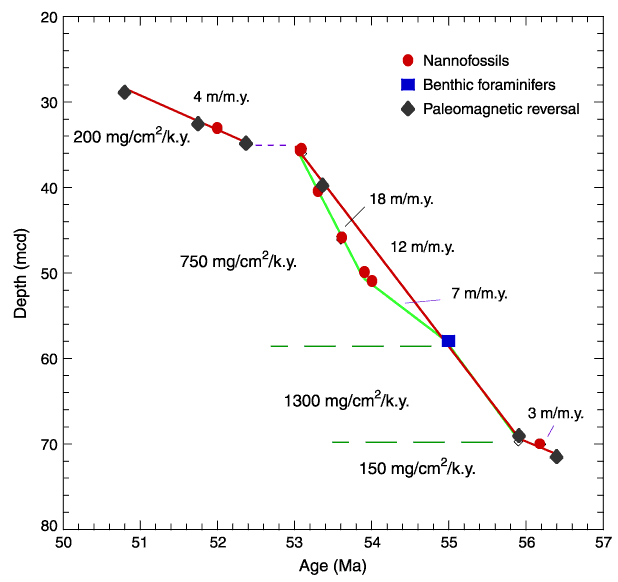
Figure F13. Plot of biostratigraphic and paleomagnetic datum levels (see Tables T8 and T9) vs. composite depth. Individual symbols represent different types of stratigraphic datums: solid circle = nannofossil datum, solid square = benthic foraminifer extinction event, and solid diamond = magnetic reversal. The short, horizontal dashed line = suspected hiatus in the sedimentary section. Solid line segments = linear regressions of selected data points with the slope of these lines, indicating sedimentation rates in meters per million years (shown as different line segments on the right side of the plot). Mass accumulation rates are shown to the left of the plot (rounded to the nearest 50 mg/cm2/k.y.) (see Table T10).