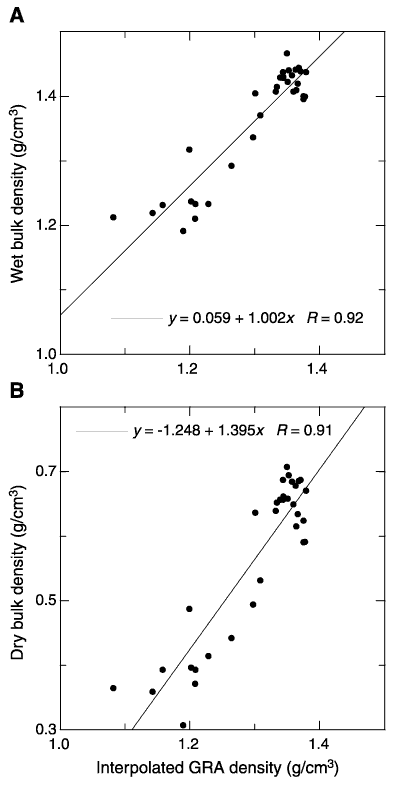
Figure F14.
(
A
) Wet and (
B
) dry bulk density from discrete samples plotted with gamma ray attenuation (GRA) bulk density interpolated with a 20-cm-wide Gaussian window.