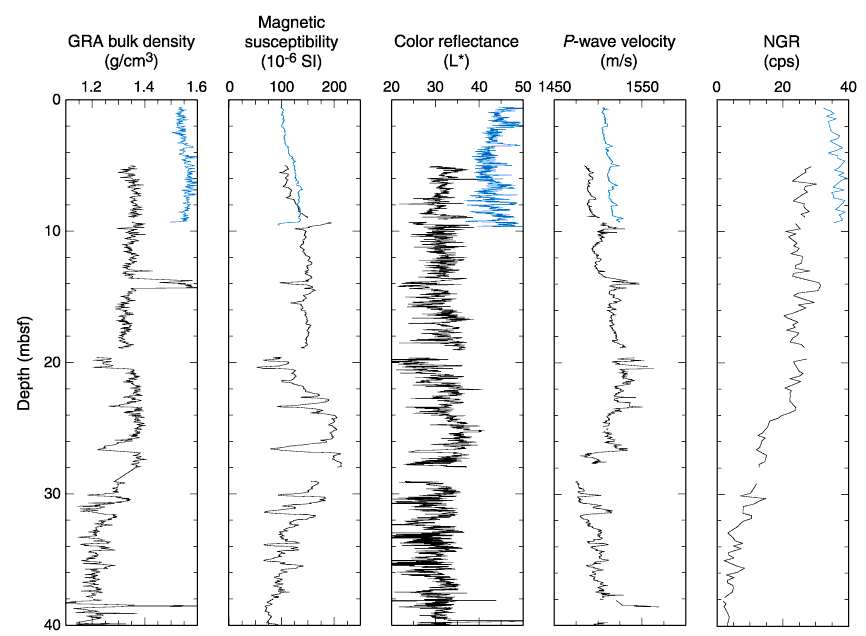
Figure F8. MST data plotted vs. depth for Holes 1216A and 1216B. Gamma ray attenuation (GRA) bulk density, MS, color reflectance, P-wave velocity, and natural gamma total count data are shown for Holes 1216A (left curve in each panel) and 1216B (right curve in each panel). The data from Hole 1216B are offset by a constant for illustration purposes. Intervals with obvious flow-in or drilling disturbance were removed from the data sets (see Table T4). cps = counts per second.


![]()