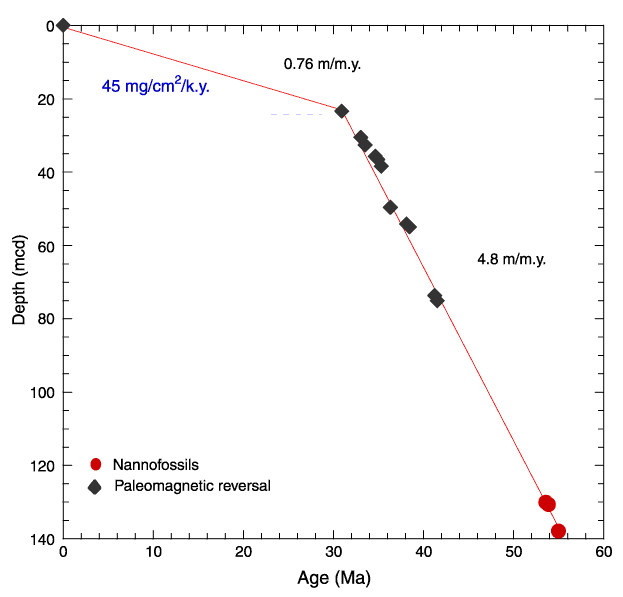
Figure F15. Plot of biostratigraphic and paleomagnetic datum levels (see Tables T7 and T8) used to constrain average LSR vs. depth. Individual symbols represent different types of stratigraphic datums: solid circle = nannofossils datums, solid diamond = paleomagnetic reversal. Solid line segments = linear regressions of selected data points with the slope of these lines indicating sedimentation rates in m/m.y., as shown next to each segment. MARs are shown as values in mg/cm2/k.y. (see Table T9). MAR values for the lower interval are shown in detail on Figure F17.


![]()