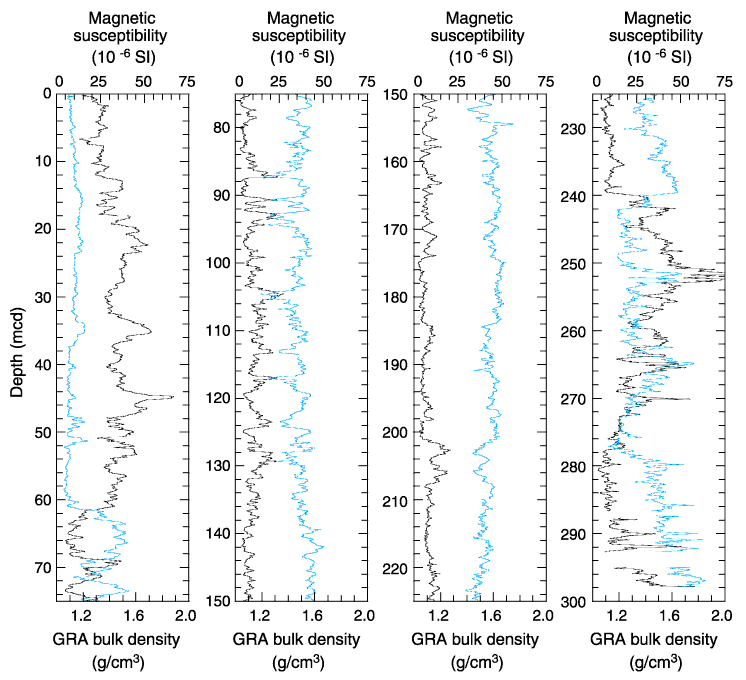
Figure F15. Spliced records of gamma ray attenuation (GRA) bulk density and magnetic susceptibility. GRA bulk density values appear either as blue or lighter lines in each panel. Note the anticorrelation between the parameters, particularly between 80 and 140 mcd. Cyclical variations in the carbonate/(clay + silica + terrigenous) ratio, with high proportions of carbonate corresponding to higher density and lower MS values, are evident throughout the record.


![]()