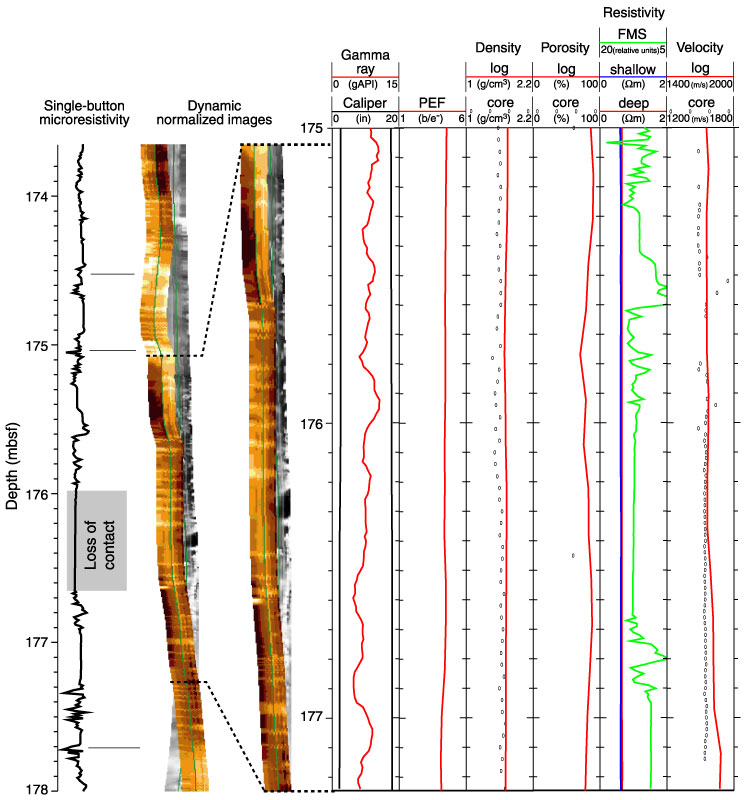
Figure F39. Formation MicroScanner (FMS) (single-button microresistivity plot and dynamic normalized image), geophysical, and geochemical log data for a section in logging Unit 1. The high-resolution gamma ray log identifies a 0.5- to 1-m cyclicity pattern, whereas the higher resolution FMS image data also identify the higher frequency cycles. PEF = photoelectric factor, gAPI = American Petroleum Institute gamma ray units.