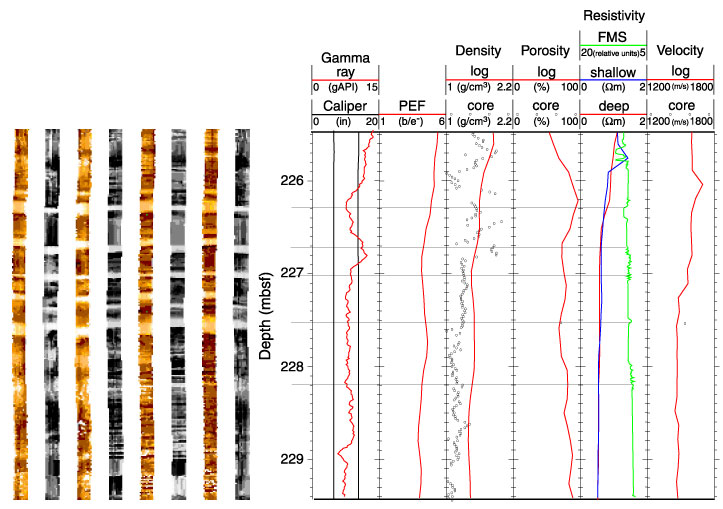
Figure F40. The chert bands in logging Unit 2, which are responsible for the resistivity and density log peaks, are easily recognizable in the Formation MicroScanner (FMS) images as the high resistivity (light) areas. A resistivity trace from an FMS button is included to show the raw data. gAPI = American Petroleum Institute gamma ray units. PEF = photoelectric effect.