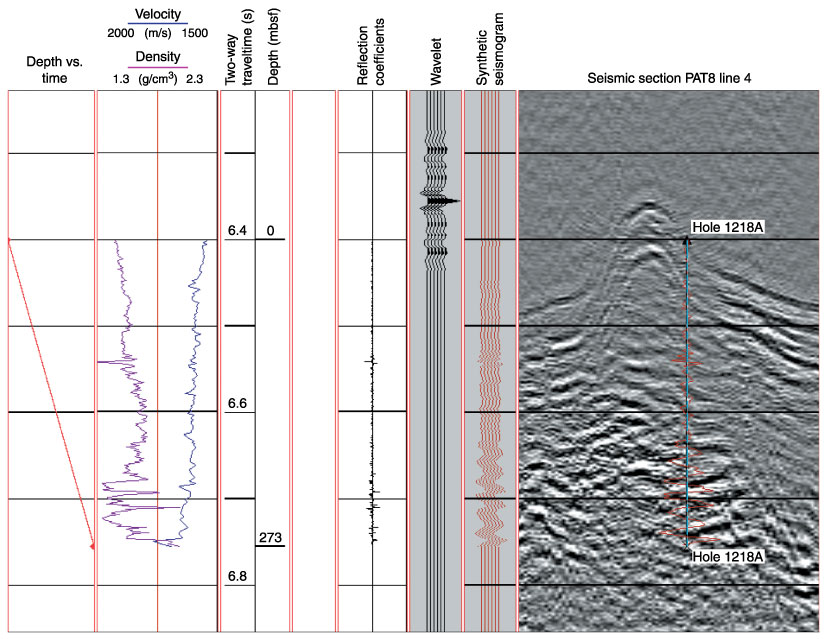
Figure F43.
Synthetic seismogram derived from velocity (split core) and density (spliced log and corrected gamma ray attenuation core) data, Hole 1218A. Depth vs. time, density, velocity, and reflection coefficient curves are also shown.