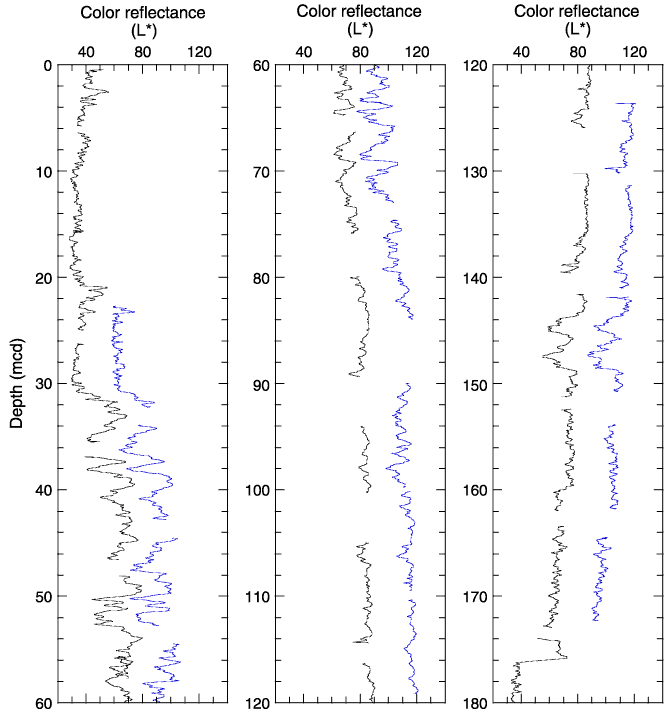
Figure F19. Color reflectance (L*) data for Holes 1219A (leftmost curve in each panel) and 1219B (rightmost curve in each panel) plotted vs. composite depth. The data from Hole 1219B are offset by a constant for illustration purposes. All data sets are smoothed with a nine-point Gaussian filter. Intervals with obvious flow-in or drilling disturbance are removed from the data sets (see Table T8).


![]()