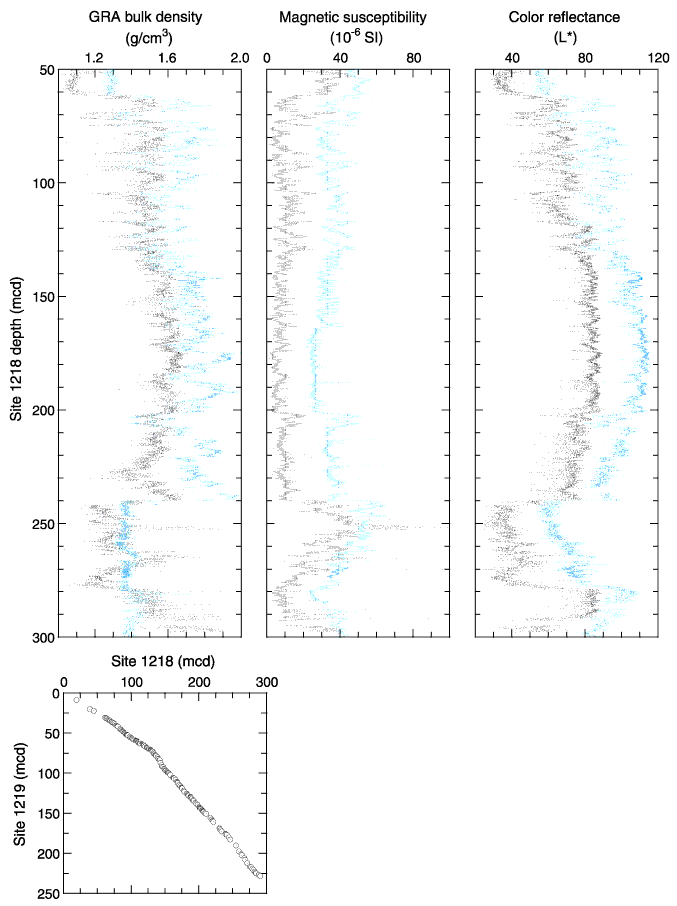
Figure F21. Spliced records of gamma ray attenuation (GRA) bulk density, magnetic susceptibility, and the color reflectance parameter (L*) compared between Sites 1218 and 1219. The data are plotted on the common depth scale of Site 1218, using the transfer function from Site 1219 mcd to Site 1218 mcd shown at the bottom of the figure. In all three data panels, constant positive offsets were applied to data from Site 1219 (blue) to facilitate visual comparison with data from Site 1218 (black).


![]()