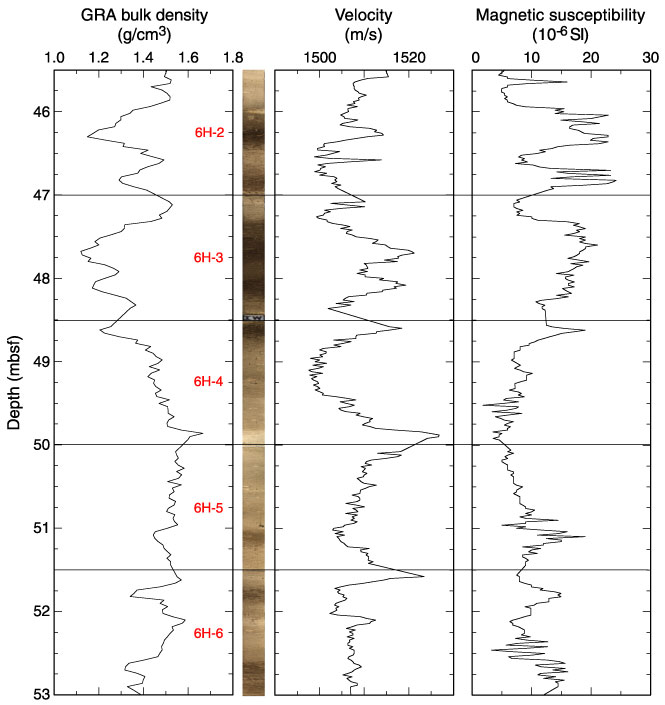
Figure F29.
Comparison of MST gamma ray attenuation (GRA) bulk density, PWL velocity, and MS with light-dark cycles found in Sections 199-1219A-6H-2 through 6H-6.