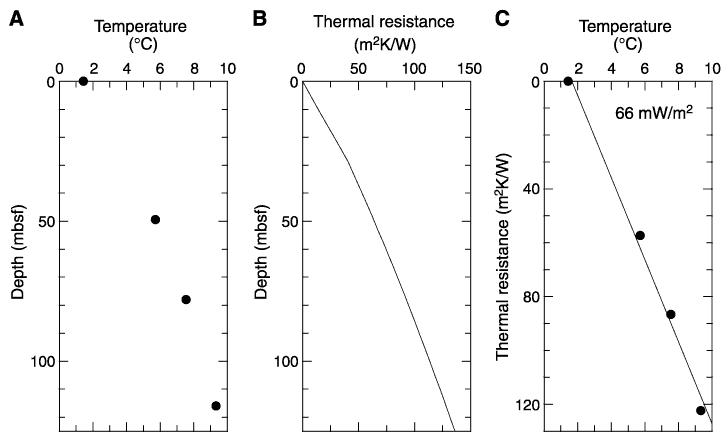
Figure F36. Heat flow calculation for Site 1219. A. Sediment temperatures in Hole 1219B. B. Thermal resistance based on a constant average in situ thermal conductivity of 0.71 W/(mĚK) in lithologic Unit I (0-30 mbsf) and a linear increase in thermal conductivity in Unit II (30-125 mbsf). C. Bullard plot where heat flow is calculated from a linear regression of all temperature data.


![]()