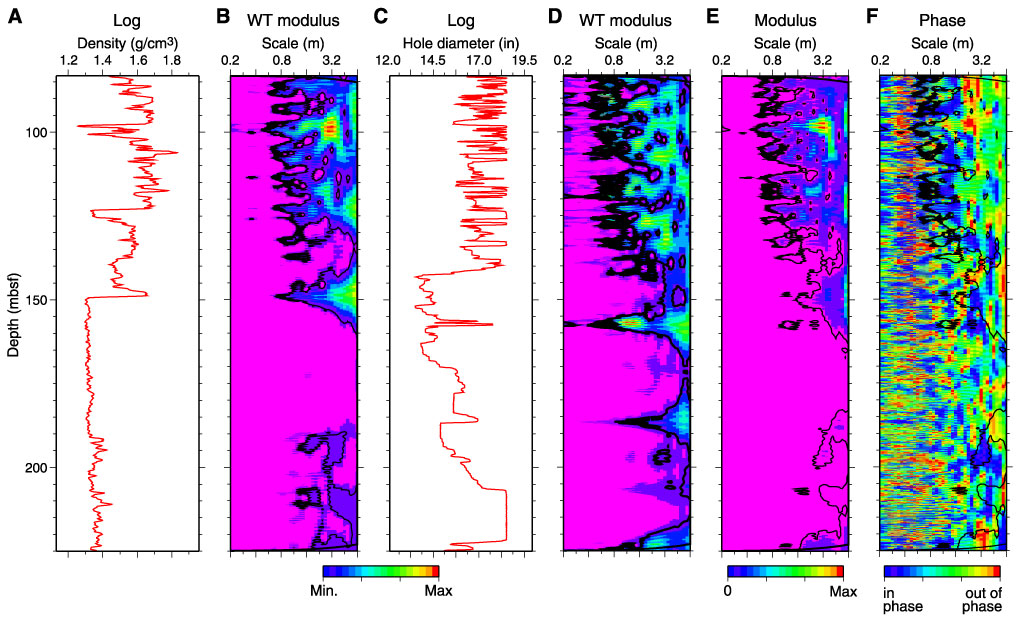
Figure F44. Wavelet transform (WT) analyses of the (A) density log in relation to (C) possible borehole wall rugosity effects from triple combo pass 1. Respective wavelet spectrum diagrams are shown for (B) density and (D) borehole diameter. The cross-wavelet spectrum is presented in the (E) modulus and (F) phase diagrams. Note the high significance region in the density wavelet spectrum at ~100 mbsf (B), which is produced by the density spike at the same depth (A).